
Figure 3.
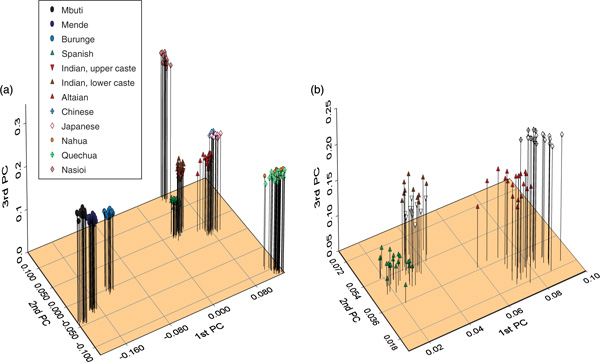
Principal components (PCs) plot of the 203 individuals based on the allele-sharing distance matrix. Individuals are the basis of analysis and have been labelled with symbols as indicated in the figure legend. The first three of four significant PCs (using the broken-stick method) axis are shown on this plot. (a) Space showing all individuals. (b) Enlarging the segment of the plot with the European and Asian populations.