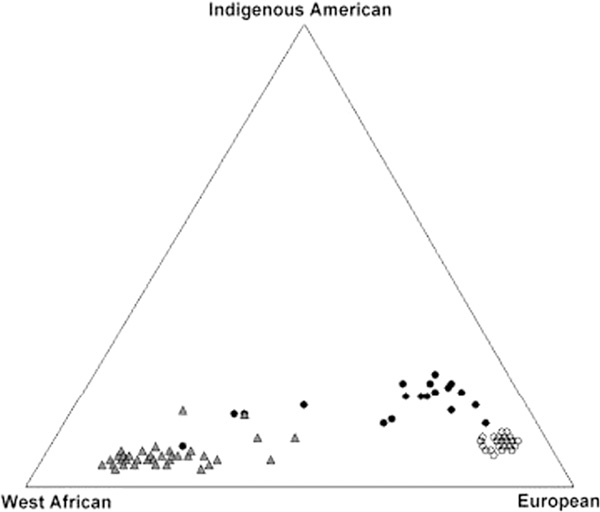
Figure 5.

Triangle plot of three populations, illustrating maximum likelihood estimates of individual ancestry. Puerto Ricans (n = 20) are shown as filled circles, African-Americans (n = 42) as grey triangles and European-Americans (n = 41) as open circles. Parental populations in this analysis are the average of the Nahua and Quechua as the indigenous American; Mende as the West African; and Spanish as the European.
