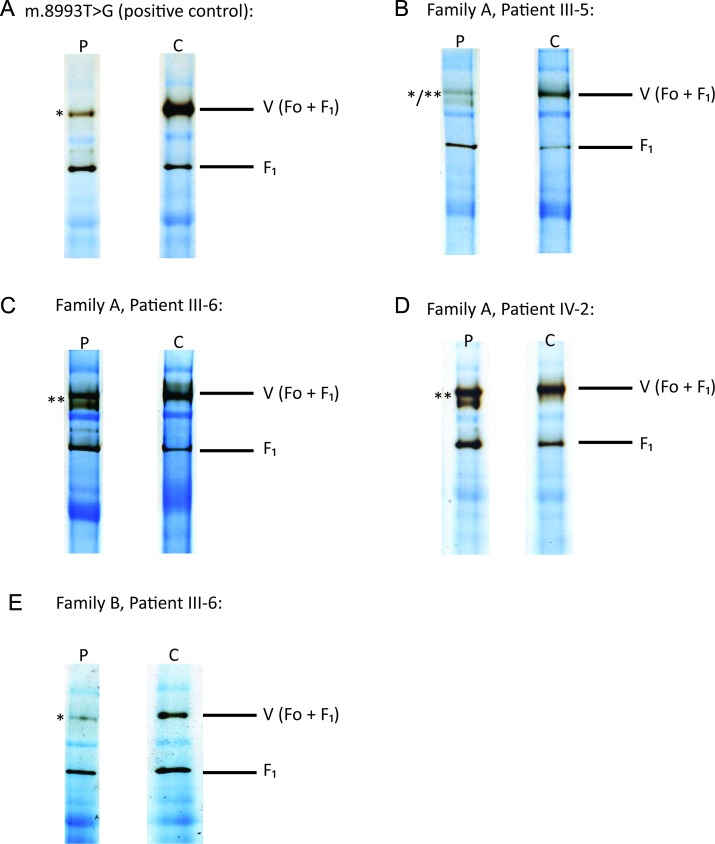
Figure 3. Blue-native polyacrylamide gel electrophoresis was performed on muscle tissue from 4 patients with the m.9185T>C mutation and 1 patient with the m.8993T>G mutation.
P = patient; C = control; V (Fo + F1) = complex V holoenzyme; F1 = F1 catalytic site of complex V only. *Reduced complex V activity in patient compared with control muscle tissue (demonstrated by reduced band density). **Impaired complex V assembly in patient compared with control muscle tissue (demonstrated by multiple bands indicative of abnormal assembly intermediates). */**Both impaired complex V activity and assembly in patient compared to control muscle tissue (demonstrated by coexistence of reduced band density and multiple bands indicative of abnormal assembly intermediates). (A) Patient with the pathogenic mutation m.8993T>G (positive control). (B–D) Family A, patients III-5, III-6, and IV-2, respectively. (E) Family B, patient III-6.

