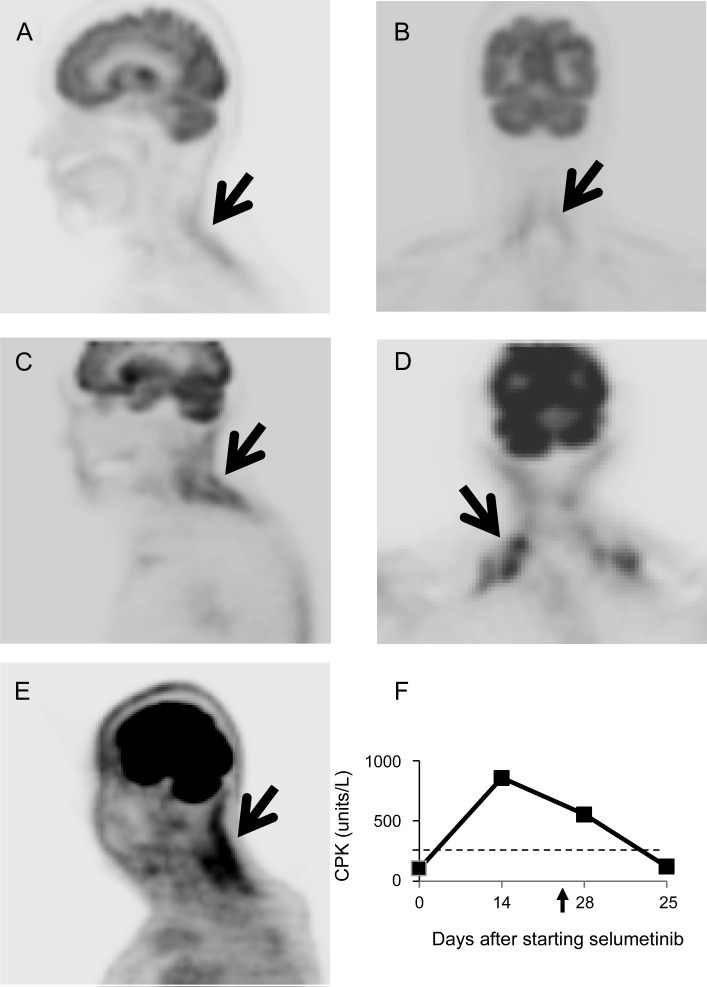
Figure. Imaging.
18F-FDG-PET from case 1 (A, B), case 2 (C, D), and case 3 (E) demonstrated increased FDG uptake in neck extensors and trapezius as indicated by the arrows. (F) Serum creatine phosphokinase (CPK) level of case 3: the arrow indicates the day of stopping selumetinib and the dashed line indicates the upper limit of the normal value.

