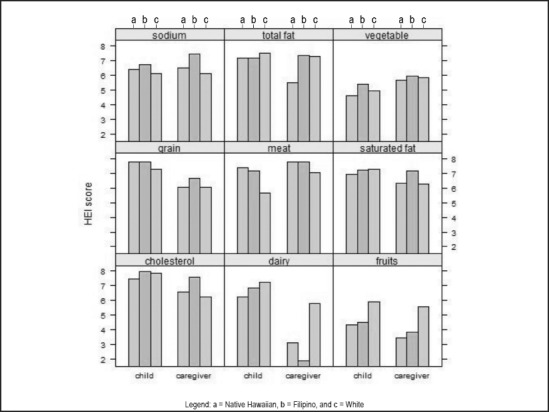
Figure 1.

Child and caregiver Healthy Eating Index (HEI) individual component scores (range 1–9). Note that for sodium, total fat, and cholesterol, higher HEI scores mean lower intakes. Models are adjusted for age, sex, and food season; PROC GLM procedure. The dairy HEI scores for Native Hawaiians and Filipinos are both statistically different from White at P<0.05 level for caregivers.
