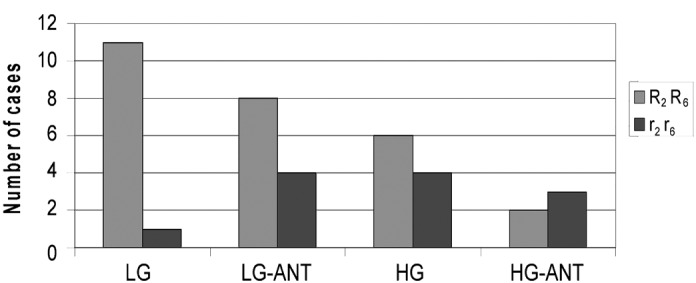
Figure 3.

Relative distribution of cases with combined reduced (r2r6) or normal or elevated (R2R6) hMSH2 and hMSH6 mRNA phenotypes to low or high grade UCCs (LG, HG) and their matched ANTs (LG-ANT, HG-ANT). UCC, urothelial cell carcinoma; ANT, adjacent normal tissue.
