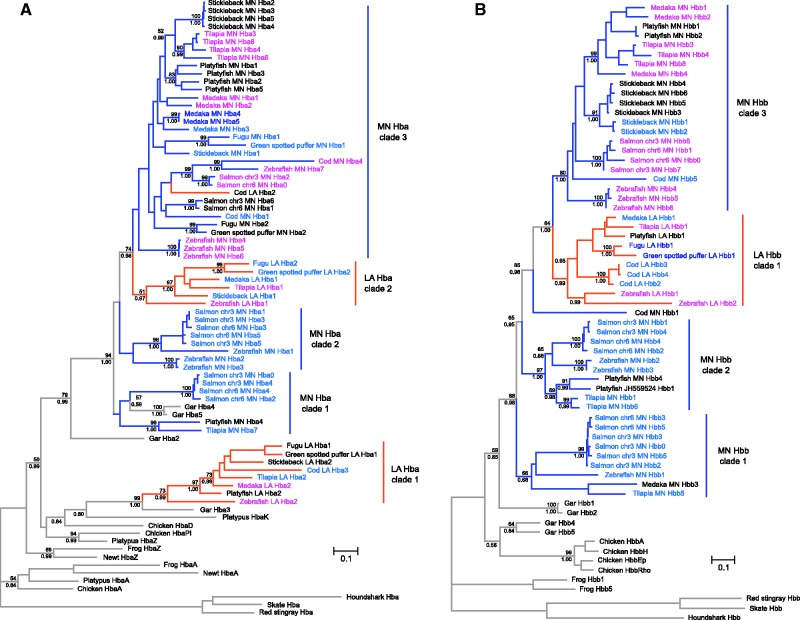
Fig. 3.
Maximum likelihood phylogram depicting relationships among the globin sequences of seven representative teleost fishes. Phylogenetic reconstructions were based on the coding sequences of α- and β-globin genes (panels A and B, respectively). Cartilaginous fish globins were used as outgroup sequences, and tetrapod sequences were included for comparative purposes. Values on the nodes denote bootstrap support values (above) and Bayesian posterior probabilities (below). Branches are color coded according to the location of the genes: MN-linked genes are shown in blue, LA-linked genes are shown in orange, and the gar genes are in green. Labels are color coded based on the timing of their expression. The substitution models selected are listed in supplementary table S3, Supplementary Material online.

