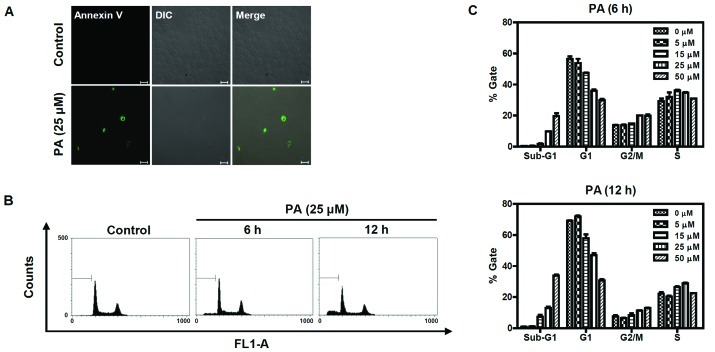
Figure 2.
Annexin V and flow cytometric analysis of PA-treated SK-OV-3 cells. (A) PA increased apoptotic cells immunostained with annexin V-FITC. Cells were treated with 25 μM PA for 6 h and stained with annexin V-FITC, then imaged under x40 objective magnification using a confocal microscope (bar=20 μm). DIC represents the differential interference contrast. (B) PA induced apoptosis in a dose and time-dependent manner. Cells were treated with different concentrations (0, 5, 15, 25 and 50 μM) of PA for 6 h or 12 h, then sub-G1 populations were measured using a flow cytometer after staining with PI. The sub-G1 populations of cells treated 25 μM of PA for 6 h or 12 h are represented as a diagram. FL1-A indicates fluorescence 1 area for the measurement of the PI fluorescence intensity (excitation, 488 nm; emission, 530 nm). (C) Three independent experiments of (B) were performed and are represented as a bar diagram. PA, pomolic acid; SK-OV-3 cells, human ovarian adenocarcinoma cells; PI, propidium iodide.

