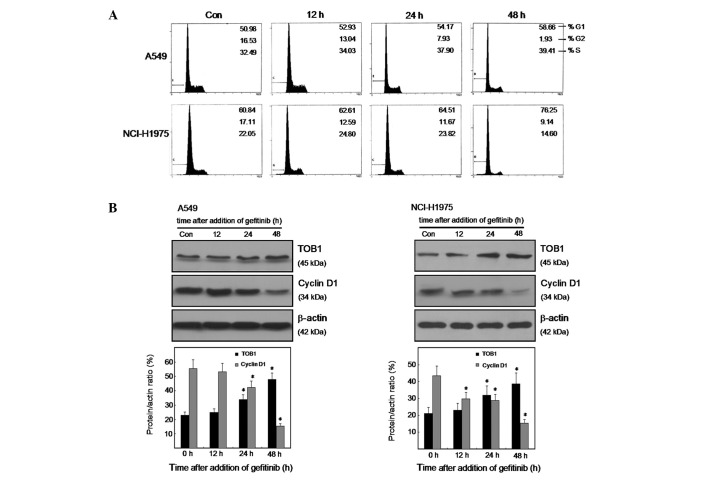
Figure 1.
Effect of gefitinib on cell cycle distribution, TOB1 and cyclin D1 expression in two lung cancer cell lines. (A) A549 and NCI-H1975 cells were treated with 10 μmol/l gefitinib for 0, 12, 24 and 48 h, fixed in ethanol, and stained with propidium iodide, and DNA content was determined by flow cytometry. The percentage of cells in each phase is indicated. (B and C) Protein lysates were prepared from A549 and NCI-H1975 cells after treatment with 10 µmol/l gefitinib, and protein expression levels were analyzed by western blotting using specific antibodies. Quantitative analysis of TOB1 and cyclin D1 protein expression was shown after normalizing the data to β-actin. All the experiments were performed independently at least three times. Statistical analysis was performed using Student’s t-test. *P<0.05.

