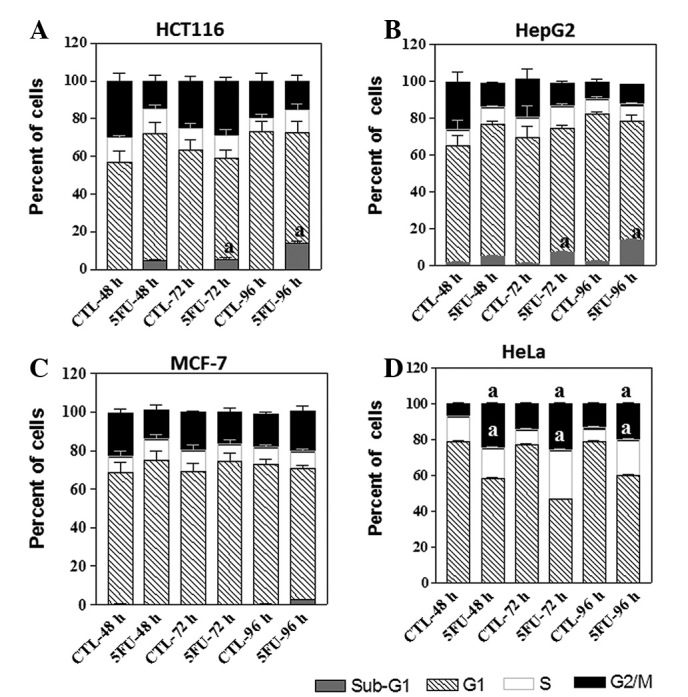
Figure 4.

Cell cycle distribution analysis of four cancer cell lines after treatment with 5FU. HCT116, HepG2, MCF-7 and HeLa cells were treated with the IC60 of each cell line (2.2, 7.0, 24.5 and 50 μg/ml 5FU, respectively) for different time intervals (48, 72 or 96 h). The cells (control and 5FU-treated) were collected by trypsinisation at the indicated time, washed, incubated with RNase and treated with propidium iodide; the DNA content was then measured by flow cytometry. (A and B) 5FU treatment led to induction of apoptosis in both HCT116 and HepG2 cells as indicated by the appearance of sub-G1 cells in the flow cytometric chart and mild arrest at G1-phase of the cell cycle after 48 h of drug treatment. (C) MCF-7 cells showed mild arrest in both G1 after 48 h and G2/M phase after 96 h of drug treatment. (D) HeLa cells blocked in both S and G2/M phases after 5FU treatment for different time intervals (48, 72 or 96 h). Graphs show the percentage of cells at each cell cycle phase at the indicated time intervals. The data are from three experiments. aStatistical significance compared with the control group, P<0.05. 5FU, 5-fluorouracil; IC60, 5FU concentration that results in 40% cell death compared with control cell growth.
