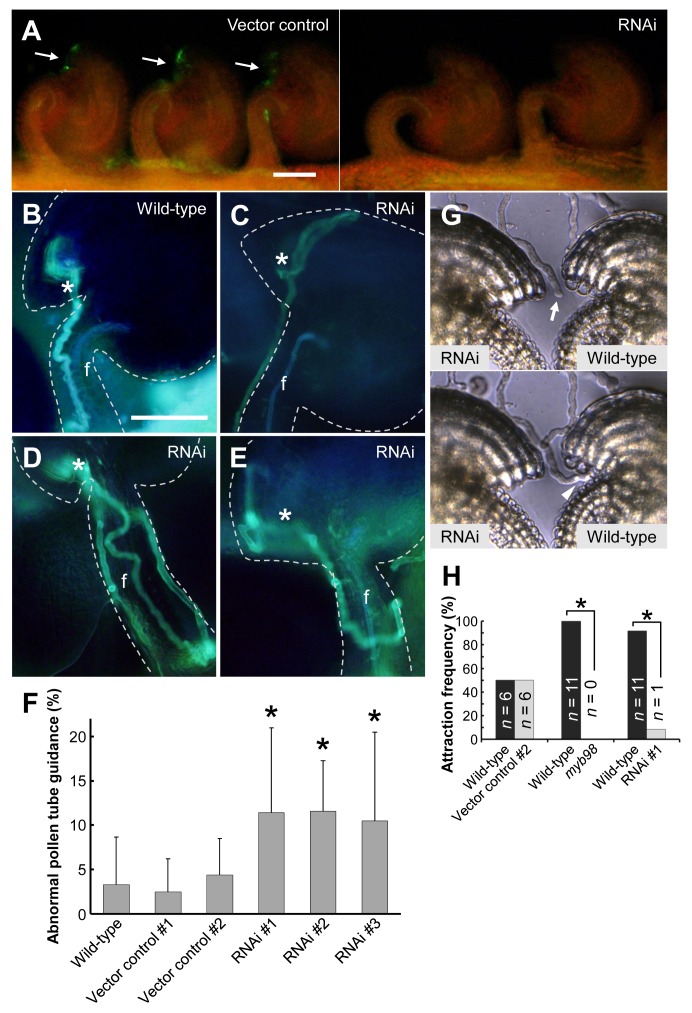
Figure 4. Knockdown analyses of the defects in micropylar guidance.
(A) Representative fluorescence microscopic image of immunostained ovules on the septum with anti-CRP810_1.2 antibodies for the vector control and RNAi line. Arrows indicate fluorescence around the micropylar end of the ovules. Scale bar, 50 µm. (B–E) Aniline blue staining for pollen tubes inside the pistil. Asterisks indicate the micropylar opening. The ovule is delineated by the dashed line. f, funiculus. (B) The pollen tube was attracted normally to the wild-type ovule. (C) The pollen tube went past the micropylar opening and then turned back and grew into the micropyle. (D) The pollen tube growing on the funiculus (left side) went back down (right side) near the micropylar opening and then grew on the funiculus again (center) and reached the micropyle. (E) The wandering pollen tube failed to grow into the micropyle. Scale bar, 50 µm for (B–E). (F) Summary of abnormal pollen tube guidance around the micropylar opening in wild-type and transgenic ovules. Sums of class I and class II abnormalities in pollen tube guidance are shown. The data are averages and standard deviations of the frequencies per pistil. The total numbers of counted ovules are 339, 230, 183, 389, 135, and 173 for wild-type, vector control #1, #2, RNAi #1, #2, and #3 ovules, respectively. The frequencies of RNAi lines (#1–3) are significantly different from the wild type (asterisks, p<0.01). (G and H) In vitro comparative pollen tube attraction assay. (G) An arrow indicates the tip of the pollen tube that was initially between the wild-type and RNAi ovules (upper panel). The pollen tube was preferentially attracted to the wild-type ovule (lower panel). An arrowhead indicates the pollen tube entering the wild-type micropyle. (H) Summary of attraction frequencies in this assay. The attraction frequencies for the wild-type ovule (black boxes) or competing ovules (gray boxes) are represented collaterally. The numbers (n) are the total number of pollen tubes competitively attracted to the ovules. Asterisks indicate significant differences from a 1∶1 ratio in the binomial test (p<0.01). Also see Figure S4.

