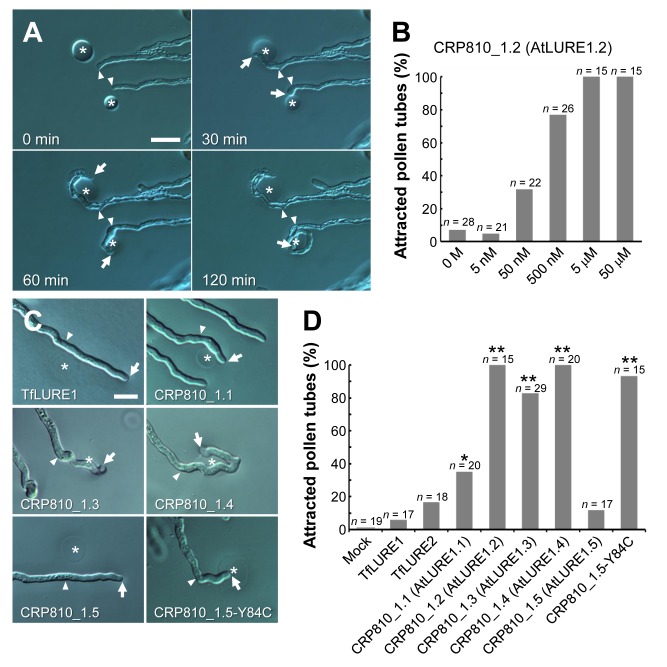
Figure 5. In vitro pollen tube attraction assay using recombinant proteins.
(A) Pollen tube attraction toward gelatin beads containing 50 µM histidine-tagged CRP810_1.2. Arrowheads mark the position of the pollen tube tips when the gelatin beads (asterisk) were placed (0 min). Arrows indicate the tips of pollen tubes growing toward the beads 30 and 60 min after placement. At 60 min, the upper pollen tube was spontaneously disrupted and the lower pollen tube was trapped at the bead. Scale bar, 20 µm. (B) Concentration-dependent pollen tube attraction activity of CRP810_1.2 (AtLURE1.2). The data are the frequencies for the total number of pollen tubes (n) in at least three assays. Pollen tubes growing toward beads with a >30° change were designated as attracted pollen tubes. (C) Representative samples of attracted or non-attracted pollen tubes to recombinant TfLURE1 and CRP810_1. Arrowheads mark the position of the pollen tube tip when the gelatin beads (asterisk) were placed. Arrows indicate the tips of the pollen tubes. Scale bar, 20 µm. (D) Summary of the rates of attraction of the pollen tubes to each recombinant protein. The data are the frequencies for the total number of pollen tubes (n) in at least three assays per protein. An asterisk and double asterisks indicate significant differences compared with buffer alone (0 M) (Figure 5B) using Fisher exact test (*p<0.03; **p<0.01). Also see Figure S5.

