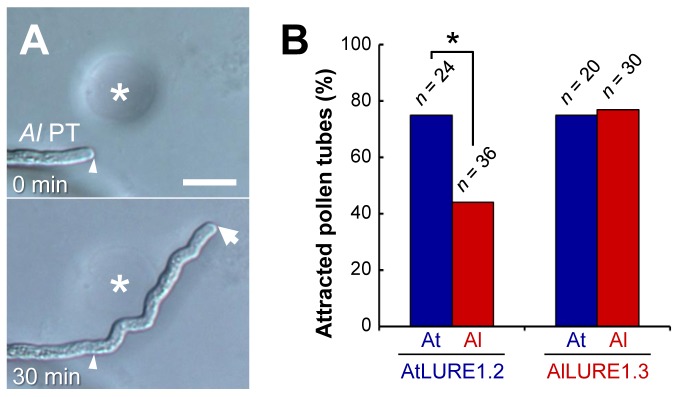
Figure 6. Pollen tube attraction of A. lyrata and species preferentiality of AtLURE1 and AlLURE1 peptides.
(A) A representative example of an attracted pollen tube of A. lyrata (Al PT) to recombinant AlCRP810_1.3 (AlLURE1.3). Arrowheads mark the position of the pollen tube tip when a gelatin bead (asterisk) was placed. An arrow indicates the tip of the pollen tube. Scale bar, 20 µm. (B) Attraction activity of AtLURE1.2 (5 µM) and AlLURE1.3 (50 µM) to A. thaliana and A. lyrata pollen tubes. The data represent the frequencies of the total number of attracted pollen tubes (n) in at least three assays. An asterisk indicates a significant difference according to Fisher exact test (*p = 0.033). Note that the effective rate for each recombinant peptide is unknown because of differing efficiencies in peptide refolding.

