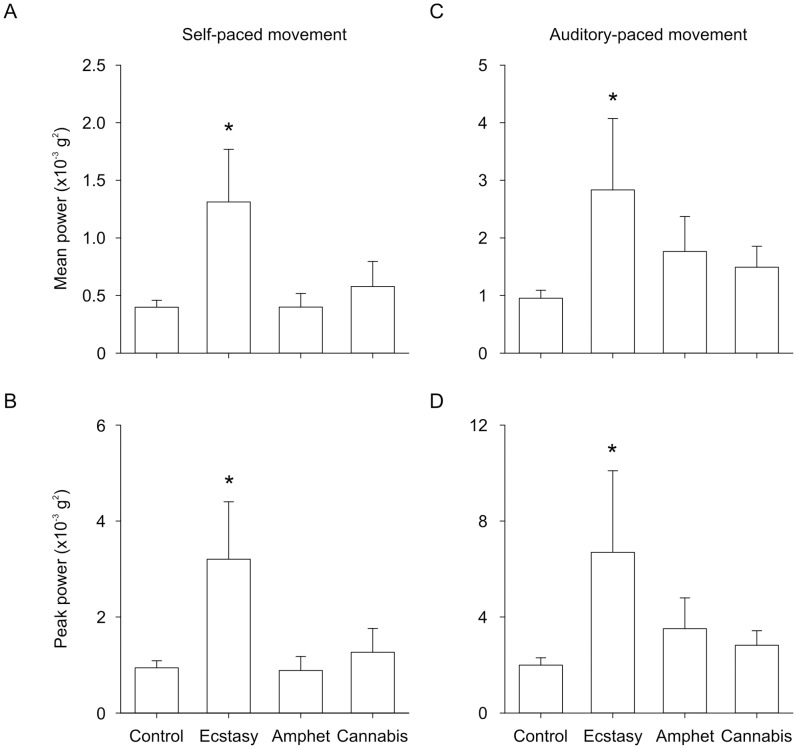
Figure 2. Group data showing the amplitude of tremor in the physiological frequency range (7.4–13.3 Hz).
The amplitude of tremor (i.e. power in the fast Fourier transform) for the ecstasy, amphetamine, cannabis, and control groups are shown. A) Mean power in self-paced movement. B) Peak power in self-paced movement. C) Mean power in auditory-paced movement. D) Peak power in auditory-paced movement. *Significantly different from control group (P<0.017).

