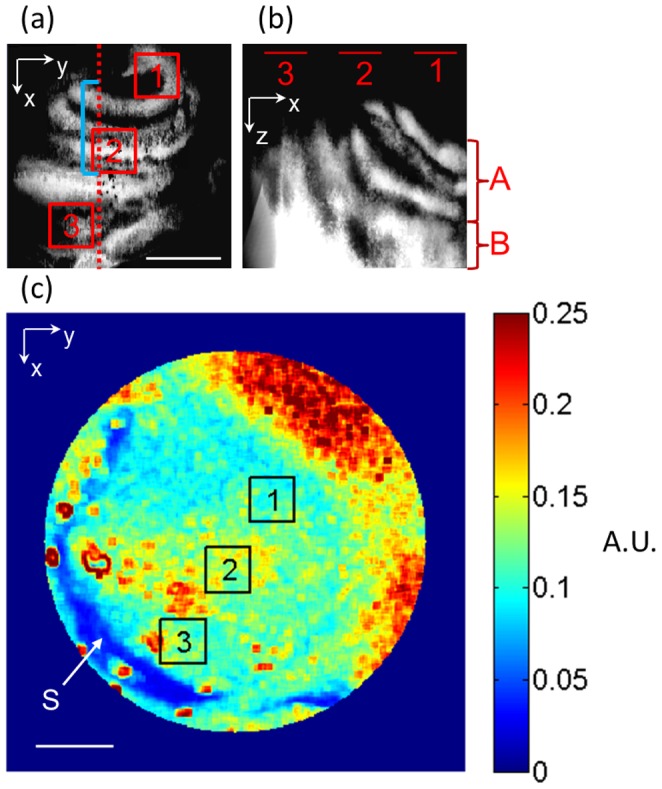
Figure 2. Localization of cochlear regions.

(a) Maximum projection view of the scalas inside the cochlea in the z-direction (en-face). The red-dotted line is the cross-section visualized by the DOMAG systems during the hypoxic challenge. The blue line highlights the location of the lower apical turn. (b) Maximum projection view of the scalas inside the cochlea in the y-direction. The apical (A) and basal (B) turn regions have been indicated. (c) Laser speckle contrast image of the cochlea, highlighting the stapedial artery (S). Scale bar = 500 µm. Three regions of interest are shown. A.U. = arbitrary unit.
