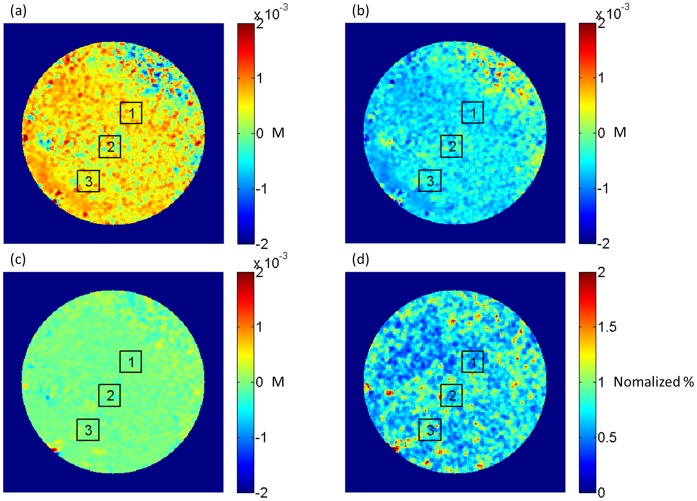
Figure 3. Image of changes in the ischemic parameters.
Spatial map indicating the changes in the concentration of (a) deoxyhemoglobin, (b) oxyhemoglobin and (c) total hemoglobin at the last minute of the hypoxia. (d) Spatial map indicating the relative change in blood flow in normalized percent. Three regions of interest are shown. M = molar.

