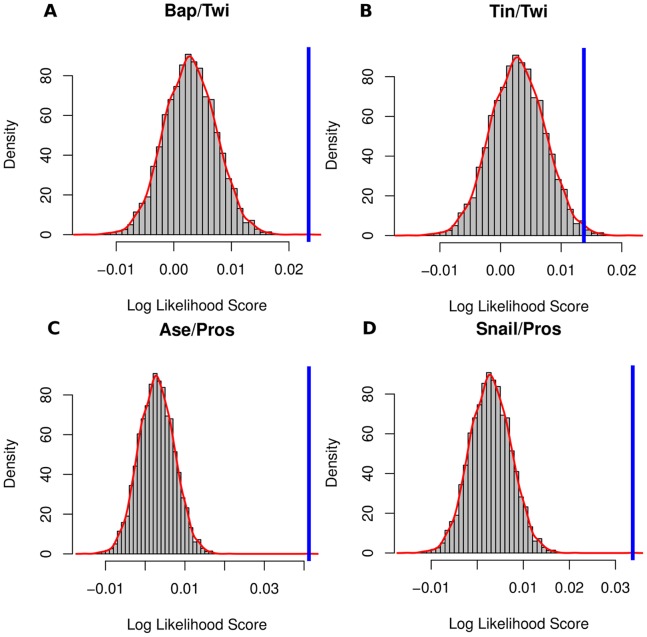
Figure 2. Selected examples of the statistical significance of the identified co-occurrence patterns.
The statistical significance of selected motif pairs from the different genome-wide datasets is depicted. The log likelihood score (blue bar) of the motif pairs Bap/Twi (A), Tin/Twi (B), Ase/Pros (C) and Snail/Pros (D) is shown in relation to the log likelihood score distribution of the background (red curve).

