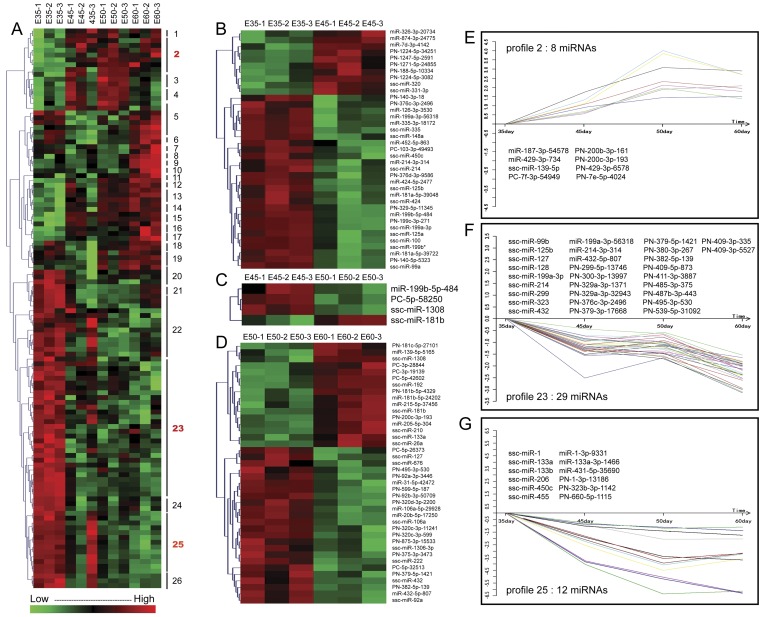
Figure 3. MiRNA expression profiles at different developmental stages by hierarchical clustering and STC analysis.
(A) We found 116 miRNAs that were differentially expressed among the four developmental stages (p<0.05). Red indicates a gene that is highly expressed at that stage. Green indicates opposite gene that is lowly expressed at that stage. MiRNA expression was analyzed using the STC method, and 26 model profiles were defined. Three gene expression patterns were significant (p<0.05) (red boxes). (B–D) Pair-wise comparisons revealed that 37 miRNAs were differentially expressed (p<0.05) between E35 and E45, 4 between E45 and E50, and 40 between E50 and E60. (E–G) miRNA expression profiles 2, 23, and 25 in tooth germ tissue. The horizontal axis represents time, and the vertical axis shows the time series of miRNA expression after log-normalized transformation.

