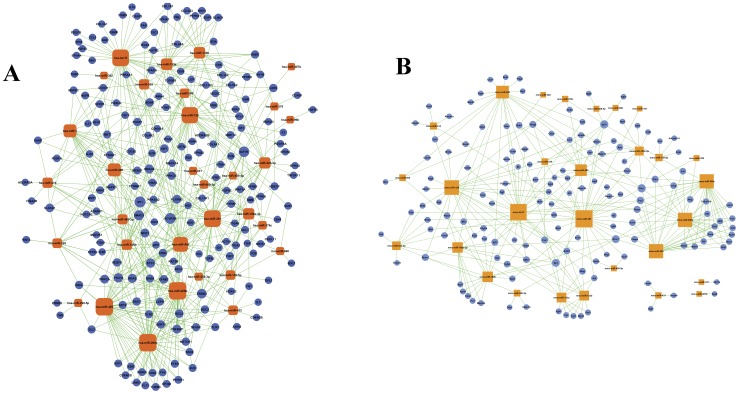
Figure 4. MicroRNA-gene network.
Circular nodes represent genes, and rounded rectangle nodes represent miRNAs. The size of the nodes represents the power of the interrelation among the nodes, and edges between two nodes represent interactions between genes. The more edges a gene has, the more genes that interact with it, and the more central a role it has within the network. (A) The top five key miRNAs in the human network were hsa-miR-200b, hsa-miR-200c, hsa-miR-429, hsa-miR-381, and hsa-let-7f. The top five key mRNAs were SP1, ACVR2B, IGF1R, SMAD2, and ERBB4. (B) The top five key miRNAs in the mouse network were mmu-miR-381, mmu-let-7f, mmu-miR-128, mmu-miR-200b, and mmu-miR-200c. The top five key mRNAs were Ets1, Igf1r, Nr3c1, Sp1, and Frs2.

