
Figure 2. Conformational change of S87 after phosphorylation.
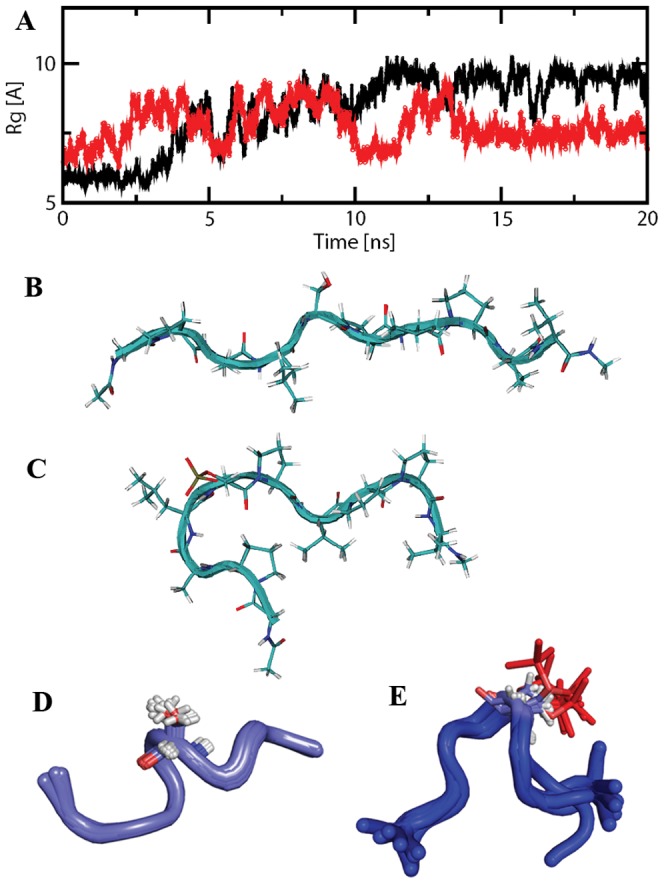
(A) Trajectories of radius of gyration (Rg) for peptide S87 in an unphosphorylated (black line) and a phosphorylated (red line) state. (B) Representative structure of the largest-member cluster of unphosphorylated S87 peptide from the final 5 ns simulation trajectory. (C) Representative structure of the largest-member cluster (84%) of phosphorylated S87 peptide from the final 5 ns simulation trajectory. (D) NMR structure ensemble of the 10 lowest energy structures for S87 peptide. (E) NMR structure ensemble of the 10 lowest energy structures for pS87 peptide. Serine and phosphoserine groups are highlighted with sticks.