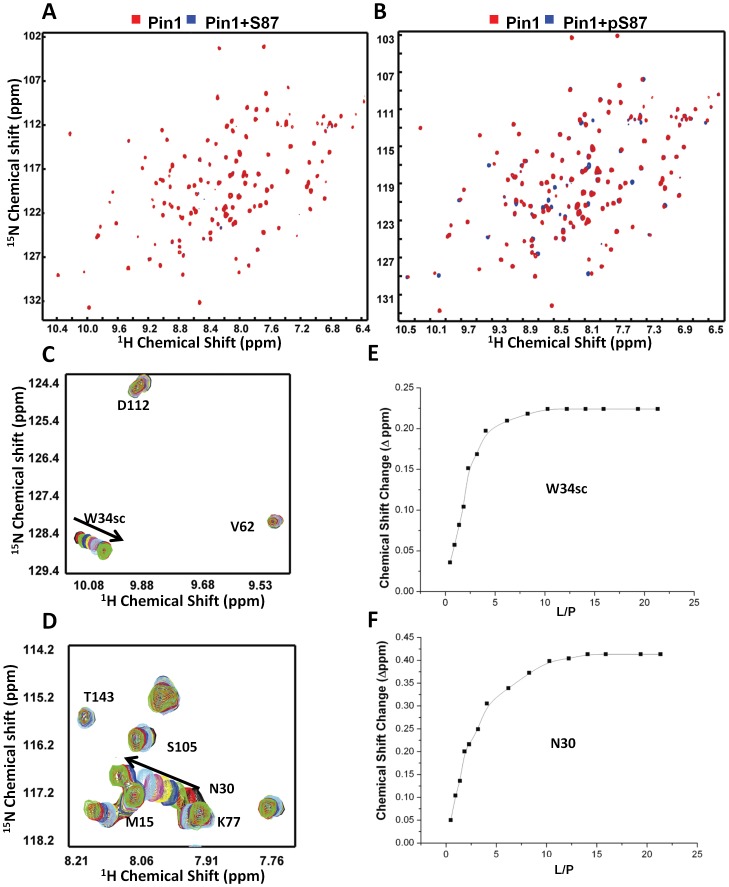
Figure 3. Pin 1 binds to the phosphopeptide derived from the flexible loop of Bcl-2.
The 15N-labeled Pin1 (0.1 mM) was recorded with (A) 0.8 mM S87 and (B) phosphorylated S87 (pS87). The 1H-15N-HSQC spectra with or without peptide are show in blue and red, respectively. (C, D) Some of the amino acid chemical shifts change with the increasing peptide concentration. The arrows show the direction of chemical shift perturbations with an increasing concentration of ligand. (E, F) The relationship between chemical shift change and the ratio between ligand and protein was drawn. Values of KD were calculated from the graphs using the equation described in “Materials and methods”.

