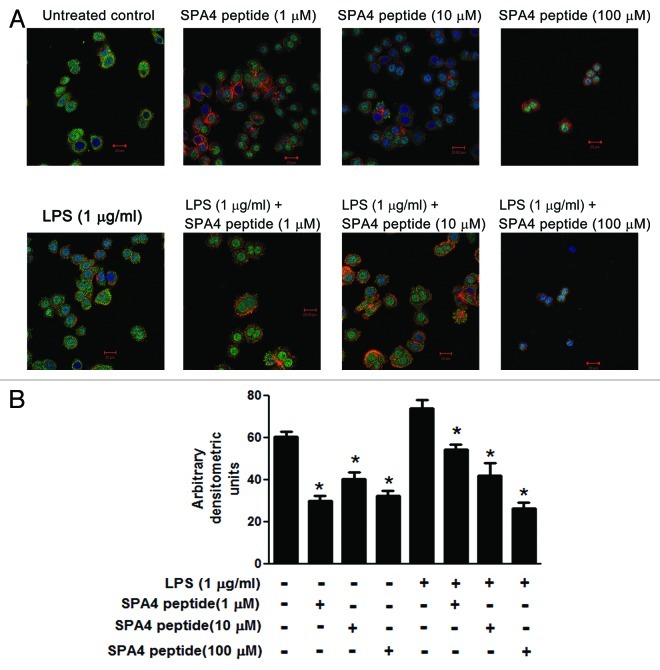
Figure 3. Effect of SPA4 peptide on TLR4 expression. (A, B) SW480 cells were challenged with 1 µg/mL lipopolysaccharide (LPS) for 4 h and treated with SPA4 peptide (1, 10 and 100 µM) for 1 h. Cells were subsequently stained with Alexa fluor 488-labeled antibody specific for TLR4 (green), nuclear stain Hoechst 33342 (blue) and cytoplasmic phalloidin stain (red). (A) Confocal images of representative fields are shown for untreated cells, cells treated with 1, 10 or 100 µM SPA4 peptide, and cells challenged with 1 µg/mL LPS alone, and LPS-challenged cells treated with 1, 10 or 100 μM SPA4 peptide. (B) Confocal images of different fields were acquired for the cells in which both the nucleus and the cytoplasm were visible in the same plane. The fluorescent staining for TLR4 was quantified by densitometry. Mean (± SEM) densitometric units are shown as bars. Results are from one out of three independent experiment. *p < 0.05 vs. LPS-challenged cells (ANOVA).

An official website of the United States government
Here's how you know
Official websites use .gov
A
.gov website belongs to an official
government organization in the United States.
Secure .gov websites use HTTPS
A lock (
) or https:// means you've safely
connected to the .gov website. Share sensitive
information only on official, secure websites.
