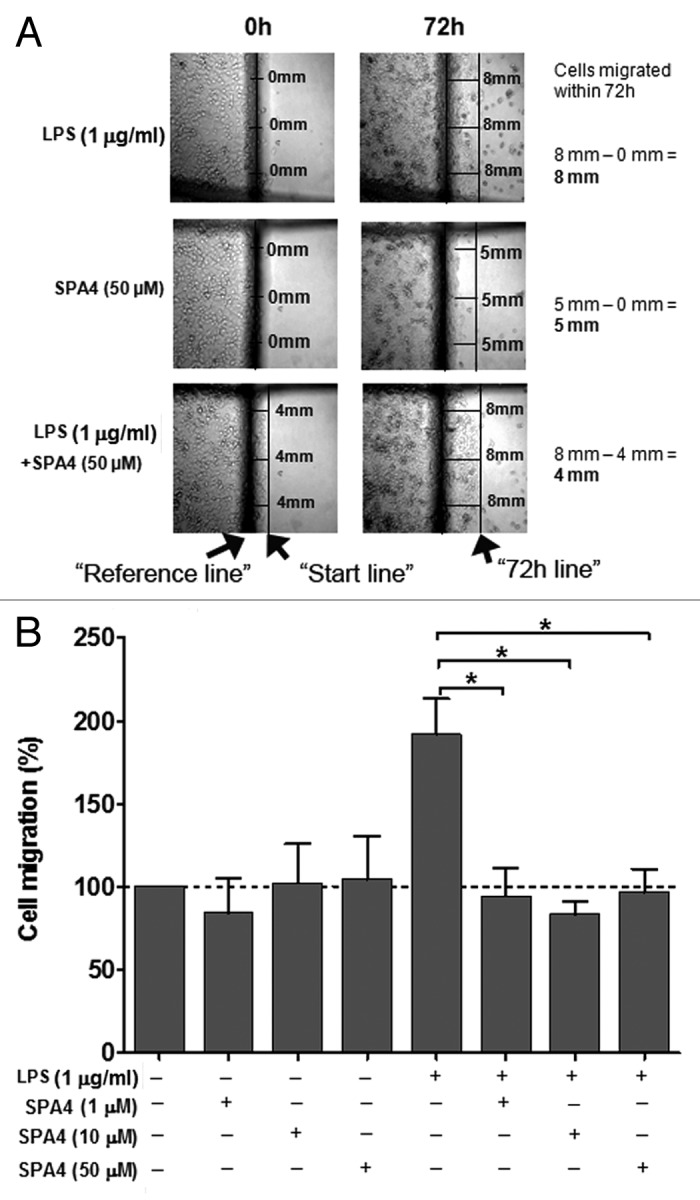
Figure 7. Inhibition of lipopolysaccharide (LPS)-stimulated migration of SW480 cells by the SPA4 peptide. (A) Photomicrographs are shown from one out of four independent experiments. At the beginning of the experiment, a “reference line” (central dark line) and markers were drawn at the bottom of the plate. After scraping, the cells were challenged with 1 µg/mL LPS for 4 h and then treated with SPA4 (1, 10 and 50 µM). On 0 h images, a “start line” was drawn to represent the starting points for cells. On 72 h images, a second line was drawn along the edge of cells to represent the migration. (B) Percent cell migration was calculated for LPS ± SPA4-treated cells as compared with untreated control cells for each experiment. The bar chart represents means (+ SEM) of four independent experiments. *p < 0.05 vs. LPS-challenged cells (ANOVA).
