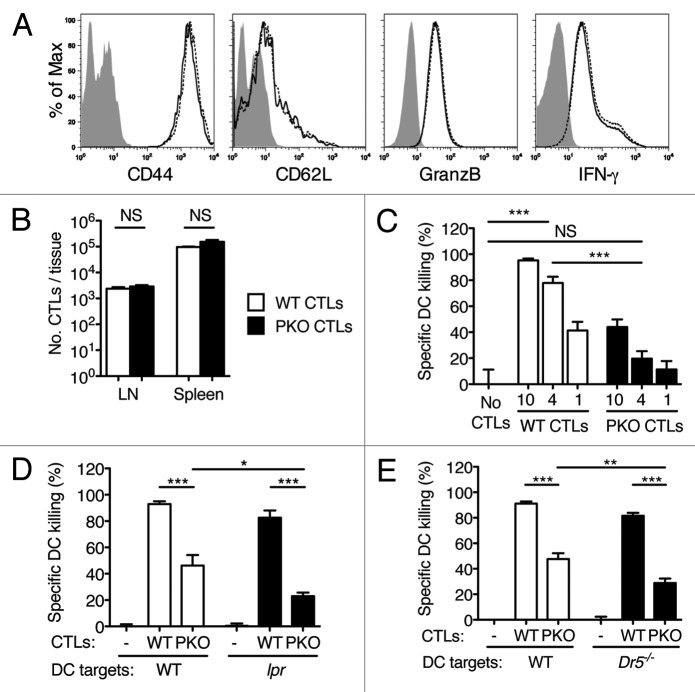
Figure 1. CTL-mediated killing of DCs in vivo is mainly perforin-dependent and is modestly affected by inactivation of the FAS/FASL or TRAIL/DR5 pathways. (A-E) WT and PKO CTL were generated in vitro by culturing TCR-transgenic T cells with DCs and Ag. Activated T cells were expanded in IL-2 for 1–2 d, and transferred i.v. into naïve syngeneic recipients. One day later recipient mice were injected s.c. with DCs loaded or not with Ag. DC survival was determined in the draining LN 48 h after DC injection. (A) CTL phenotype before transfer. WT and PKO L318 CTLs were generated as described, re-stimulated with specific peptide (IFNγ only) and examined for the expression of the indicated activation markers by flow cytometry. Filled histograms: unstained CTLs; solid line, WT CTLs; dashed line, PKO CTLs. (B) Recovery of WT and PKO L318 CTLs from the spleen and LNs of naïve recipients one day after transfer. The bar graph shows means + SEM for 3 mice/group. (C) In vivo killing of Ag-loaded WT DCs by WT or PKO L318 CTLs. Recipient mice were injected with 10, 4 or 1 million CTLs as indicated; DC killing was examined in draining LN 48h after DC challenge. The bar graph shows means + SEM for 3 mice/group. (D, E) In vivo killing of Ag-loaded WT, Faslpr or Dr5−/− DCs by WT and PKO OT-I CTLs. Recipient mice were injected with 5 × 10⁶ CTLs and 0.5 × 10⁶ DCs; DC killing was examined in draining LN 48 h after DC challenge. Bar graphs show means + SEM for groups of 3–6 mice, and are representative of 2–8 experiments that gave similar results. NS: not significant; *: 0.01 < p < 0.05; **: 0.001 < p < 0.01; ***: p < 0.001 by one-way ANOVA with Tukey’s post-test.

An official website of the United States government
Here's how you know
Official websites use .gov
A
.gov website belongs to an official
government organization in the United States.
Secure .gov websites use HTTPS
A lock (
) or https:// means you've safely
connected to the .gov website. Share sensitive
information only on official, secure websites.
