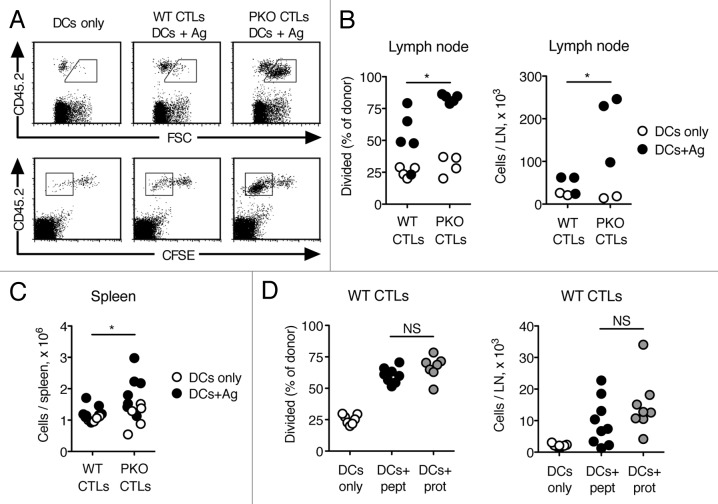
Figure 2. PKO CTLs respond more vigorously than WT CTLs to vaccination with Ag-loaded DCs. (A-D) WT CTLs and PKO CTLs were generated as described in the legend to Figure 1, labeled with CFSE and transferred i.v. into CD45-congenic recipients. One day later recipient mice were vaccinated s.c. with Ag-loaded DCs or DCs only, and CTL responses were determined as detailed below. (A) Representative flow plots of WT and PKO L318 CTLs recovered from draining LN 3 d after immunization with DCs only or Ag-loaded DCs. (B) Expansion of WT and PKO L318 CTLs in draining LNs was determined 3 d after vaccination with Ag-loaded DCs or DCs only. Data are from the same experiment shown in (A). (C) Numbers of WT and PKO L318 CTLs were determined in the spleen 7 d after s.c. vaccination with Ag-loaded DCs or DC only. (D) Expansion of WT OT-I CTLs in draining LNs was determined 3 d after vaccination with DCs loaded with peptide Ag (DCs+pept), DCs loaded with protein Ag (DCs+prot), or DCs only. Each dot represents one mouse. Data are from one of 2–6 experiments that gave similar results (A, B), or combined from two independent experiments (C, D). Statistical analysis refers to the comparison between mice that received DCs loaded with Ag. NS: not significant; *: 0.01 < p < 0.05; **: 0.001 < p < 0.01 by Student's t-test (B, C) or one-way ANOVA with Tukey’s post-test (D).

An official website of the United States government
Here's how you know
Official websites use .gov
A
.gov website belongs to an official
government organization in the United States.
Secure .gov websites use HTTPS
A lock (
) or https:// means you've safely
connected to the .gov website. Share sensitive
information only on official, secure websites.
