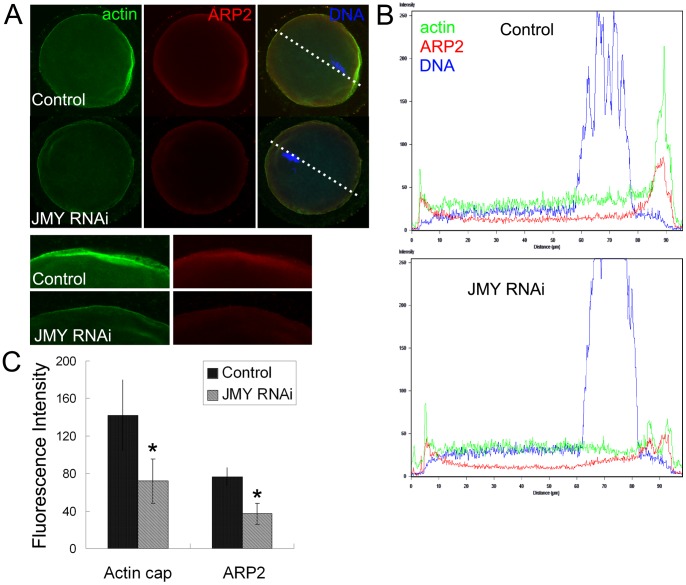
Figure 2. Expression and localization of actin and ARP2 after the injection of JMY siRNA.
(A) Localization of actin and ARP2 in oocytes by immunofluorescence staining after JMY RNAi. The expression of actin and ARP2 was significantly weaker in the JMY RNAi group. Green, actin; red, ARP2; blue, chromatin. (B) Fluorescence intensity curve of dotted line area in oocytes. The fluorescence intensity of actin and ARP2 was significantly weakened in the JMY RNAi group. (C) The average fluorescence intensity of actin and ARP2 in mouse oocytes. *, significantly different (p<0.05).

