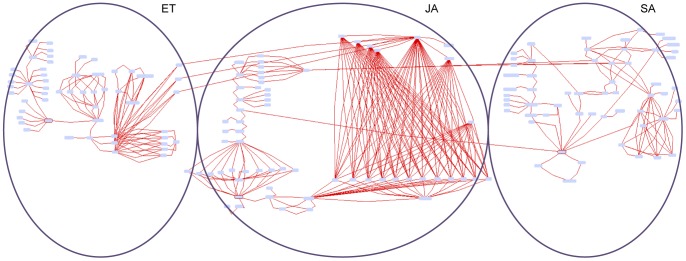
Figure 3. Manually constructed PDS model topology visualised as an edge-labelled graph.
This graph, consisting of 175 nodes and 387 edges, is provided in Supporting Information S2 as an interactive graph visualised with the Biomine graph visualisation engine, enabling its closer inspection by zooming into its subparts and rearranging the node and the arc positions in the 2D space. The graph is organised into SA, JA and ET pathways with their crosstalk connections. The node borders of the main pathway components SA, JA and ET are coloured with red.

