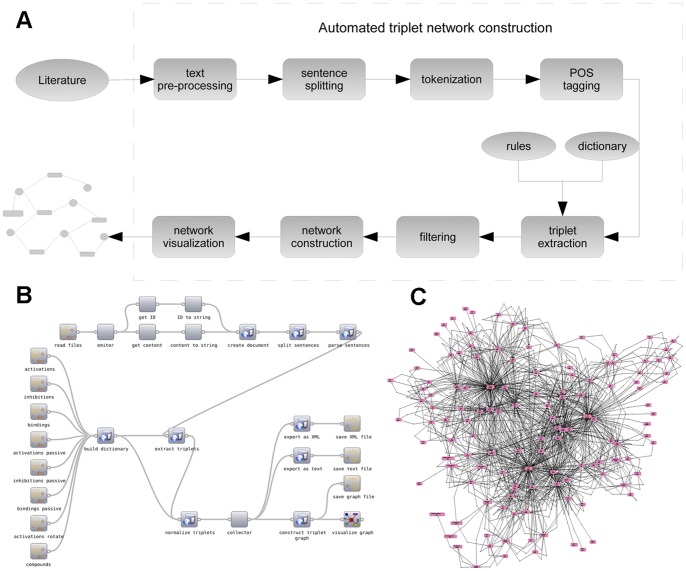
Figure 5. Overview of the Bio3graph methodology, its implementation and a sample output.
A) Schematic representation of the Bio3graph methodology. Text processing is performed in a workflow according to the boxes in the schematic diagram resulting in a network of (component1, reaction, component2) triplets. B) Bio3graph as a workflow implemented in Orange4WS. C) The triplet network extracted and composed by Bio3graph. The output network (consisting of 129 components and 1,132 reactions) is visualised with the Biomine visualizer and made available in Supporting Information S5.

