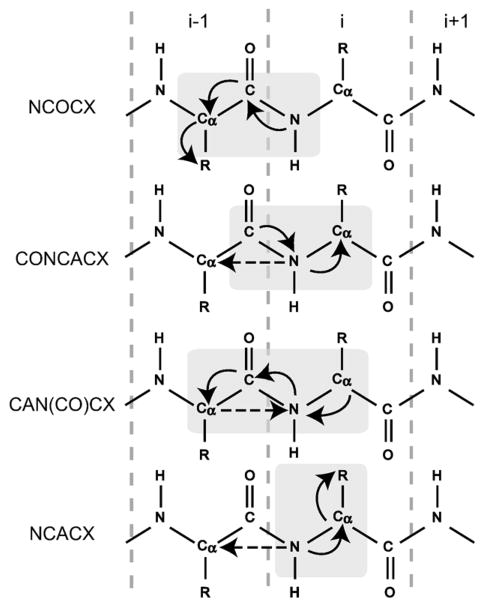
Fig. 2.
Schematic representation of the four triple-resonance experiments used to obtain sequential assignments. Correlated residues are indicated by light gray boxes. Solid arrows show dominating one-bond polarization transfers, while dashed arrows show two-bond N[i]–Cα[i−1] transfers, which could not be observed in our spectra.

