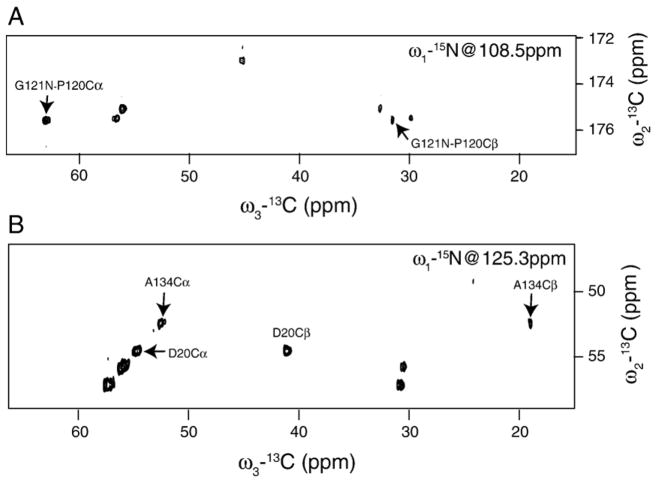
Fig. 6.
The two-dimensional 13C–13C planes of (A) the three-dimensional NCOCX, and (B) NCACX experiments. In the NCOCX experiment, a total of 120 t1 points were collected, with a maximum evolution time of 12.3 ms. A total of 100 points were taken in t2, resulting in the total evolution time of 11 ms. In the NCACX experiment, the t1 evolution time was 9.6 ms with 96 points, and the t2 evolution time was 8.3 ms with 100 points. TOBSY mixing times of 9.9 ms and 7.5 ms were used in the NCOCX and NCACX experiments, respectively. The number of scans per free induction decay (FID) was 16 in the NCOCX and 24 in the NCACX experiments. The carrier frequency was set at 175 ppm for carbon in NCOCX, at 50 ppm for carbon in NCACX, and at 116 ppm for nitrogen. The recycling delay was set to 2 s. A 50 kHz TPPM decoupling was applied on the 1H channel during 13C′–15N/13Cα–15N polarization transfers, and during direct and indirect detections.

