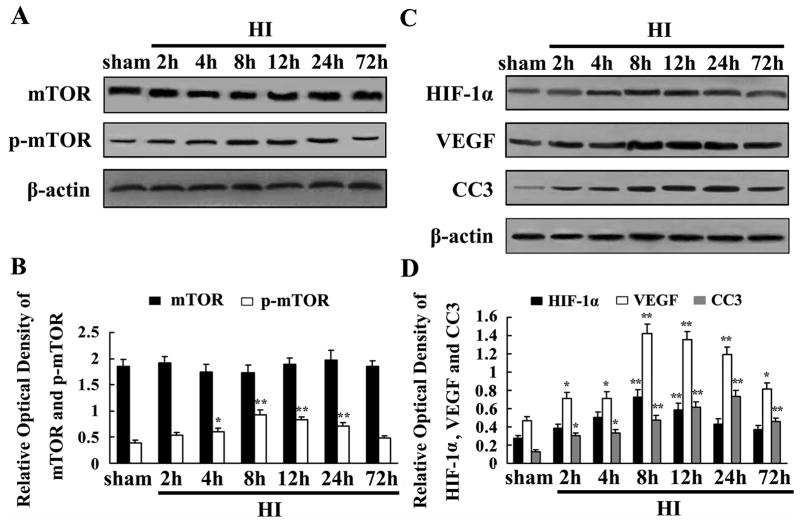
Fig. 2.
mTOR, p-mTOR, HIF-1α, VEGF and CC3 proteins expression in P10 rat brain after HI detected by Western blot analysis. Equal amount of protein samples (100 μg) was loaded, and β-actin served as loading control. Values are expressed in relative optical density and represented as mean ± SD (n=4). Total mTOR protein was not obviously changed at different time points compared with sham controls (A). However, p-mTOR protein was induced in ischemia hemisphere, peaked at 8 h, and maintained a high level at 24 h, and then declined to baseline at 72 h (A). HIF-1α and VEGF proteins were obviously induced and peaked at 8 h, then reduced at 24 h after HI (C). CC3 protein was induced at 2 h, peaked at 24 h and maintained a high level at 72 h after HI (C). mTOR, p-mTOR, HIF-1α, VEGF and CC3 expression in HI groups and sham controls were quantified. Data were obtained by densitometry and normalized by β-actin. *p < 0.05, **p < 0.01 compared with the sham control (B and D) (HI, hypoxia-ischemia).

