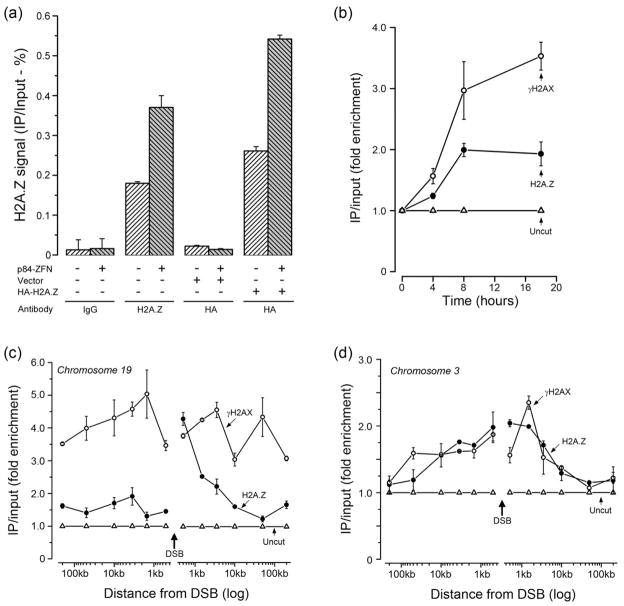
Figure 1. H2A.Z is exchanged onto nucleosomes at DSBs.
(a) 293T cells or 293T cells expressing vector or HA-H2A.Z were transfected with p84-ZFN. Cells were processed for ChIP 18hr later using either IgG, ChIP grade H2A.Z antibody or HA-antibody (for HA-H2A.Z). Real Time quantitative PCR (RT-qPCR) utilized primers located 1.5kb to the right of the DSB. ChIP signals were calculated as percent IP DNA/Input DNA. Results ± SD (n = 3). (b) 293T cells were transfected with p84-ZFN (●,○) or vector (Δ). Cells were processed for ChIP using antibodies to γH2AX (○) or H2A.Z (●), followed by RT-qPCR with primers located 1.5kb to the right of the DSB. ChIP signals were calculated as IP DNA/Input DNA and expressed as fold enrichment relative to the uncut (minus p84-ZFN; Δ) sample. Results ± SD (n = 3). (c) 293T cells were transiently transfected with vector (Δ) or the p84-ZFN (○,●). 18hr post-transfection, cells were processed for ChIP using antibodies to γH2AX (○) or H2A.Z (●), followed by RT-qPCR using the indicated primer pairs. The relative ChIP signal from the uncut, vector transfected cells is shown (Δ). Results ± SD (n = 3). (d) 293T cells were transfected with vector (Δ) or K230-ZFN (○,●), which creates a unique DSB at position 46.16Mb on chromosome 3. 18hr post-transfection, cells were processed for ChIP using antibodies to γH2AX (○) or H2A.Z (●), followed by RT-qPCR using the indicated primer pairs. The ChIP signal from the uncut, vector transfected cells is shown (Δ). Results ± SD (n = 3). See figures S1 and S2.

