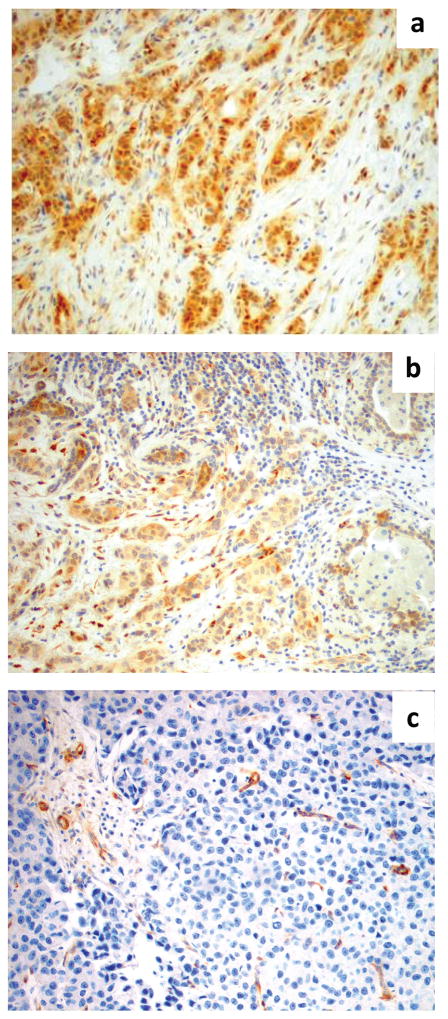
Figure 1.
PTEN scoring of tumors by IHC. Depicted are photomicrographs of PTEN scoring: a) score 2 = intensity of the immunoreaction in the tumor equal to the adjacent normal epithelium (100X); b) score 1 = intensity of the immunoreaction reduced in the tumor as compared to the adjacent normal epithelium (100X); c) score 0 = PTEN immunoreaction is absent in the tumor and present in the adjacent normal epithelium (100X).

