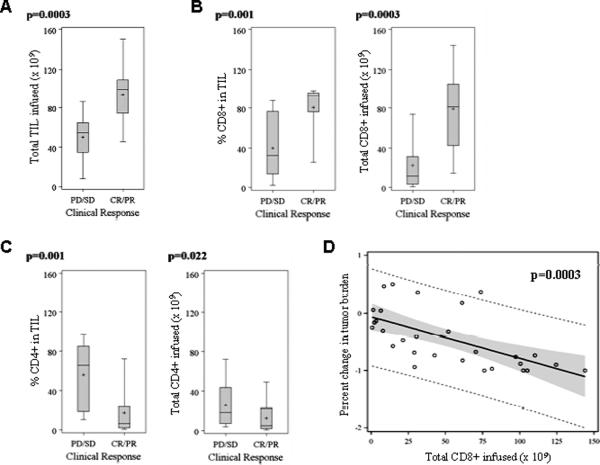
Fig. 3. Comparison of total cells infused and major T-cell subsets in the infused TIL product between responders and non-responders.
Comparison of total TIL infused (A), the percentage and total number of infused CD8+ T cells (B), and the percentage and total number of CD4+ T cells (C) between responders and non-responders. Linear regression showing the relationship between total CD8+ infused and percentage change in tumor burden (p=0.0003), with the solid line in showing the best fit, the broken line representing the 95% prediction limits, and the grey area indicating the 95% confidence limits (D).

