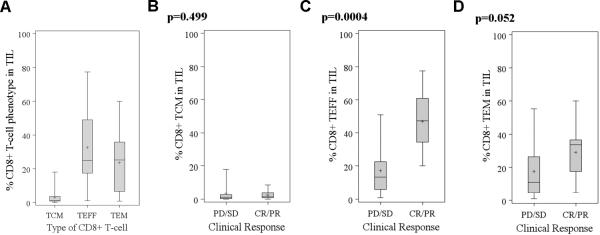
Fig. 4. Comparison of CD8+ T-cell memory phenotype in responders and non-responders.
The percentage of TCM, TEM, and TEFF in the CD8+ TIL subset in all treated patients (A). Wilcoxon rank-sum tests showed significant differences at α=0.001 between the percentage of %CD8+ TIL between TCM and TEFF (p<0.0001) and TCM and TEM (p<0.0001). In the subsequent panels, the percentage of CD8+ T cells with a TCM (B), TEM (C), and TEFF (D) in the infused TIL was compared between responders and non-responders.

