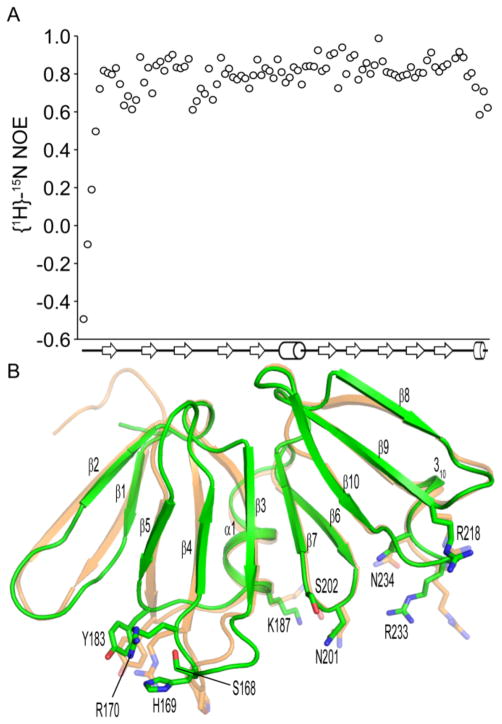
Figure 2.
Conformational differences between apo and DNA-bound AgrAC. A, Steady-state heteronuclear {1H}15N-NOE values for each residue of AgrAC plotted versus the secondary structure topology of the protein. β strands and α helices are depicted as arrows and cylinders respectively. B, Superposition of the apo AgrAC crystal structure (green) with AgrAC in its DNA-bound state (orange).22 The sidechains of amino acid residues within the DNA-binding surface that adopt different conformations between the apo and DNA-bound states are shown in stick format.

