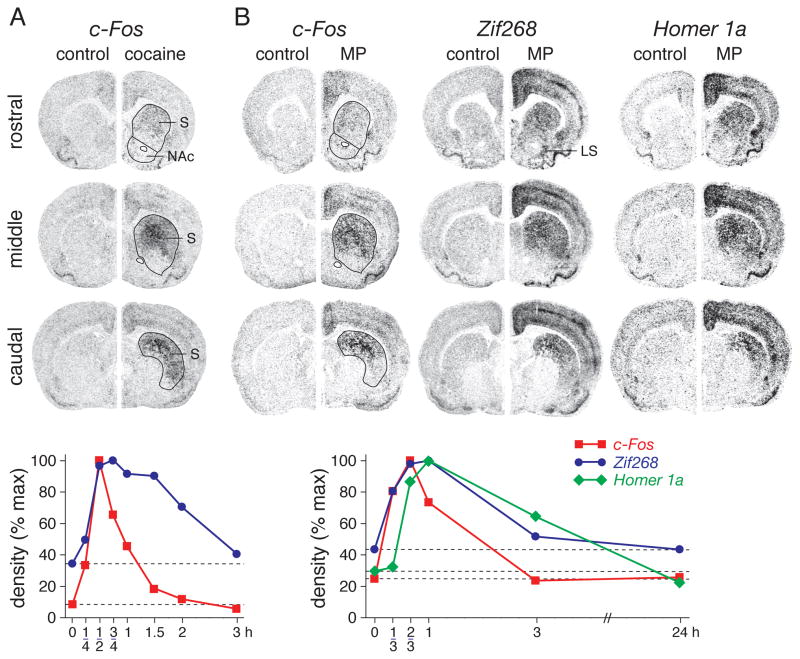
Figure 2.
Psychostimulant-induced immediate-early gene expression in corticostriatal circuits as determined by in situ hybridization histochemistry. (A) Cocaine-induced c-Fos expression. Top: Film autoradiograms depict c-Fos expression in coronal sections from rostral (top), middle (center), and caudal striatal levels (bottom) in rats that received a vehicle injection (control, left halfbrain) or a cocaine injection (25 mg/kg; right halfbrain) and were sacrificed 30 minutes later (Brandon and Steiner, 2003). Striatum (S) and nucleus accumbens (NAc) are outlined in the cocaine-treated animals. Note the considerable regional differences in the c-Fos response. Bottom: Time course of cocaine (30 mg/kg)-induced c-Fos and Zif268 expression in the dorsal striatum on the middle level (mean density, expressed as percentage of maximal induction) (Steiner and Gerfen, 1998). Basal expression is indicated by broken lines. (B) Methylphenidate-induced gene expression. Top: Film autoradiograms show c-Fos (left), Zif268 (middle), and Homer 1a expression (right) at 0 minutes (control, left halfbrain) and 40 minutes (c-Fos) or 1 hour (Zif268, Homer 1a) after methylphenidate injection (MP, 5 mg/kg, i.p.; right halfbrain) (Yano and Steiner, 2005a,b). Bottom: Time course of methylphenidate (5 mg/kg)-induced expression of c-Fos, Zif268, and Homer 1a for the dorsal striatal sector on the middle level (Yano and Steiner, 2005a,b). LS, lateral shell of nucleus accumbens

