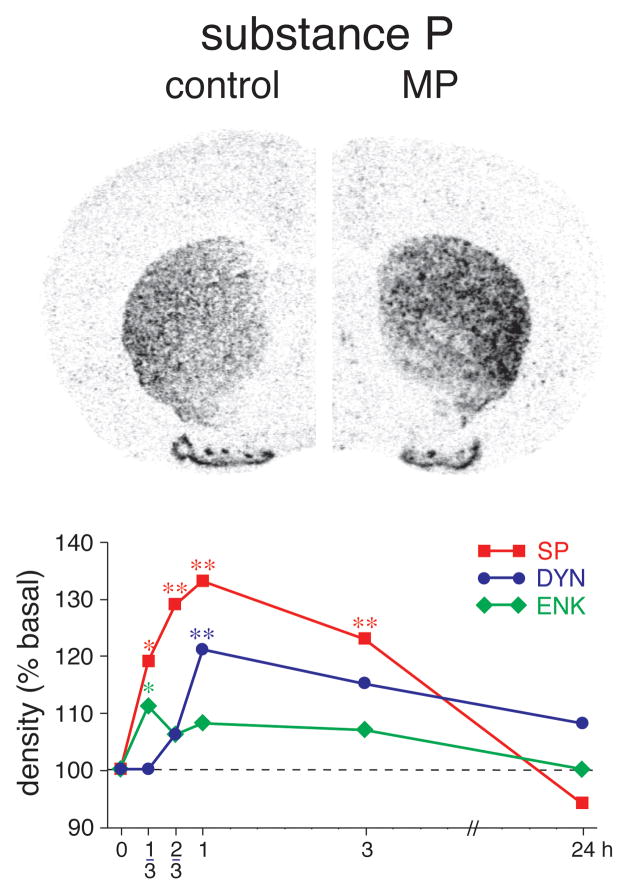
Figure 3.
Methylphenidate-induced neuropeptide expression. Top: Film autoradiograms depict substance P expression in the middle striatum at 0 minutes (control, left halfbrain) and 1 hour after injection of methylphenidate (MP, 5 mg/kg, i.p.; right halfbrain). Bottom: Time course of methylphenidate (5 mg/kg)-induced expression of substance P (SP), dynorphin (DYN), and enkephalin (ENK) (in percentage of basal expression) for the dorsal striatal sector on the middle level (Yano and Steiner, 2005b). Note that substance P expression increased in 13 of the 23 striatal sectors, whereas dynorphin and enkephalin expression significantly increased in only two and one sector, respectively (values in area of maximal increase are shown here; see Yano and Steiner, 2005b, for details). ** p < 0.01, * p < 0.05 versus 0 minutes.

