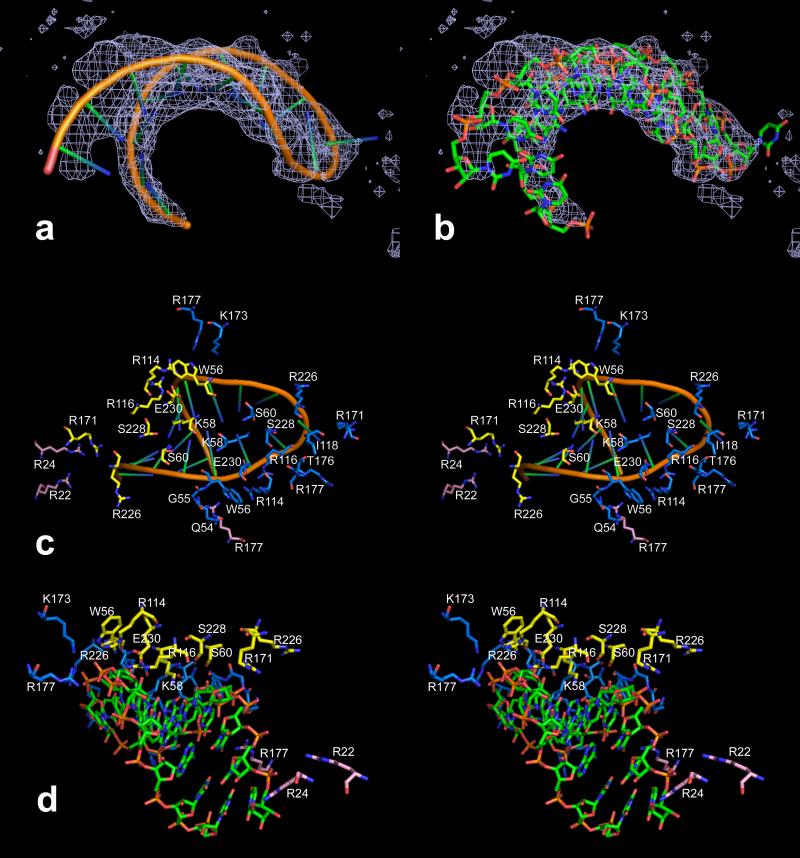
Fig. 9.
In (a) and (b), NCS averaged 2Fo–Fc electron density is shown superimposed on the model of the 17 nucleotide hairpin loop of RNA found near the interior surface of the PMV capsid. The map was calculated at 2.9 Å resolution and contoured at 0.4 sigma. In (c) and (d), stereo views of the RNA in two different representations illustrate the possible RNA-protein interactions with capsid residues. All close protein residues are labeled in (c) but not in (d). The A, B and C subunits are colored blue, yellow and pink, respectively.

