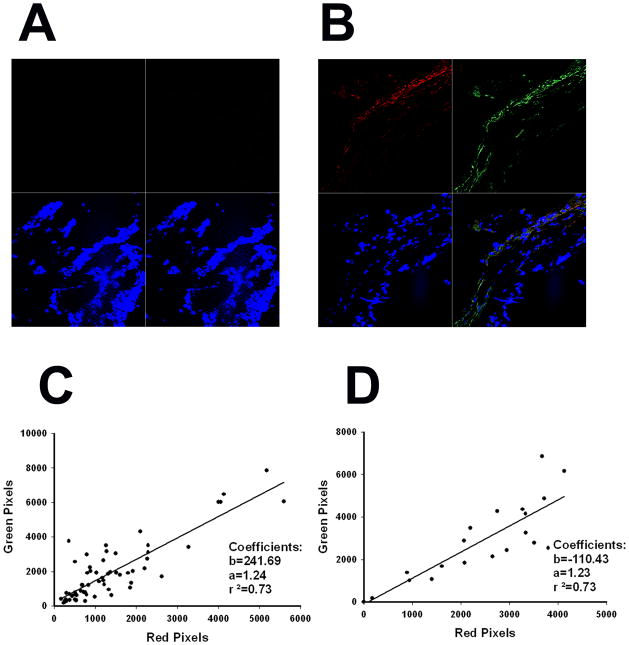
FIGURE 2. Correlation between viral presence and NIS expression.
Mice were subcutaneously engrafted with LNCaP. When tumor reached approximately 200 mm3 they were infected with Ad5PB_RSV-NIS at 1011 vp. At day three and ten post-infection mice were sacrificed and the tumors harvested and processed for confocal microscopy as described in Material and Methods.. A) Uninfected control. B) Ten days post-infection. Red quadrant hNIS, green quadrant Adenovirus hexon protein, blue quadrant DAPI, lower right quadrant merged image. The slides were quantified for red and green pixels using Adobe Photoshop CS5 digital imaging software (Adobe Systems Incorporated, San Jose, CA). C) Day three. D) Day ten.

