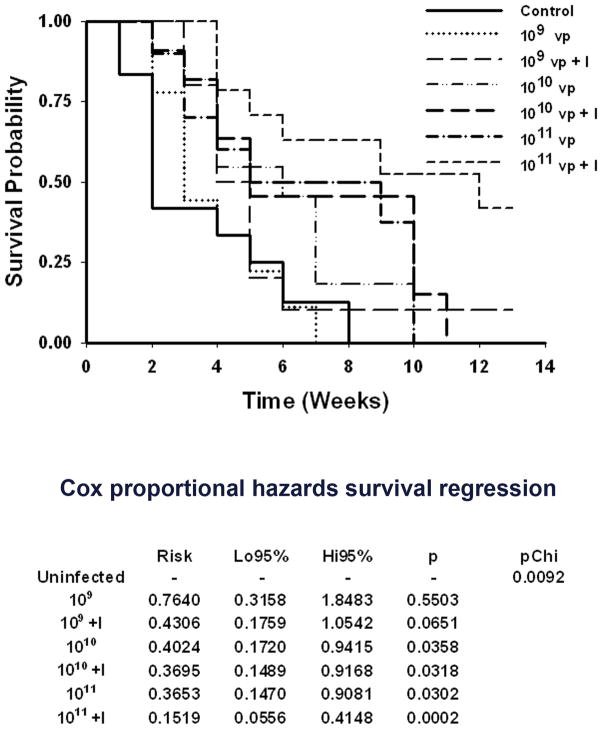
FIGURE 5. Survival analysis.
Mice engrafted with LNCaP were divided in groups randomly (average group size n=10±3). Time 0 is defined as the time of viral injection. The average tumor size at time 0 was 125±30 mm3. At time 0, virus was injected intratumorally at the indicated vp. Four days post-injection a single intraperitoneal dose of 3 mCi of 131I was administered (+I), Survival was plotted according to Kaplan-Meier and analyzed using the Cox proportional hazards survival regression.

