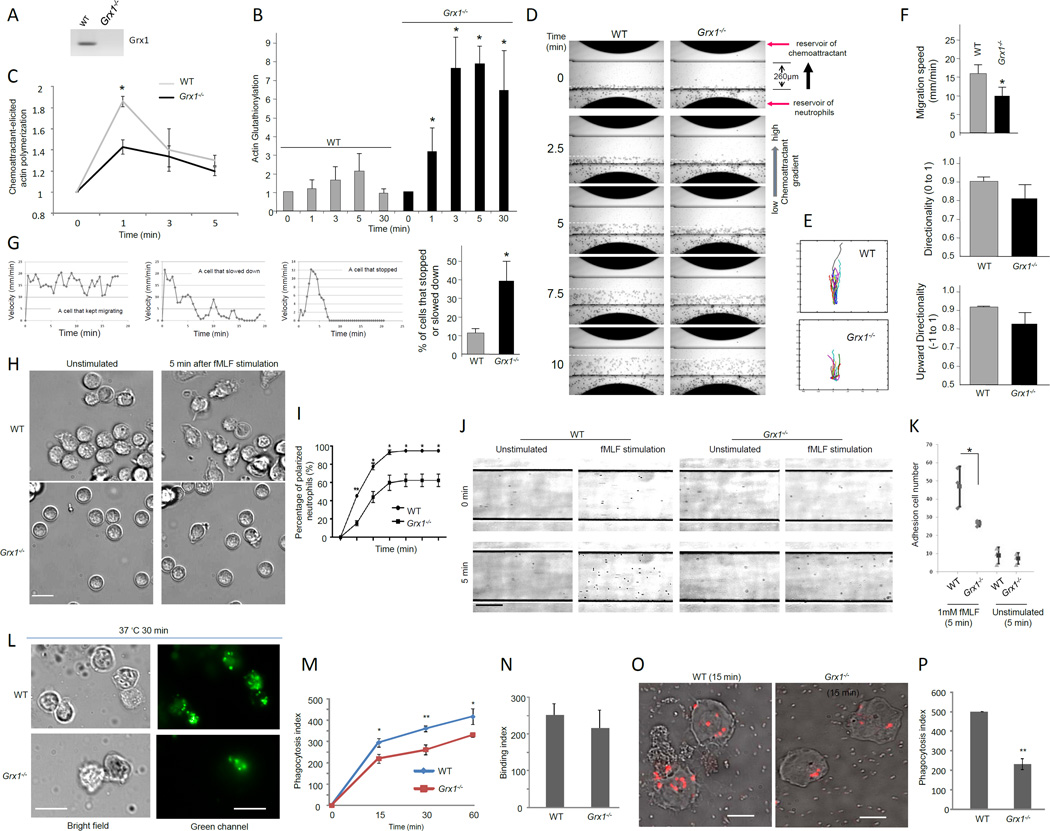
Figure 6. Disruption of glutaredoxin resulted in reduced actin polymerization and impaired neutrophil migration, polarization, adhesion, and phagocytosis.
(A) Grx1 protein expression was completely abolished in neutrophils isolated from Grx1−/− mice. (B) Glutaredoxin disruption resulted in increased amount of glutathionylated actin in neutrophils. (C) Disruption of Grx1 reduced actin polymerization. (D) Chemotaxis of mouse neutrophils in response to chemoattractant fMLF. (E) Cell tracks of migrating neutrophils (cells that move at least 65 µm from the bottom of the channel) (n=20). (F) Disruption of Grx1 reduced the efficiency of neutrophil chemotaxis. * p<0.05. (G) The percentage of cells that stopped or slowed down during chemotaxis. * p<0.0001 versus WT neutrophils. (H) Chemoattractant-induced ruffling in WT and Grx1−/− neutrophils. Scale bar represents 10 µm. (I) The percentage of polarized neutrophils (cells that ruffled or extended pseudopods) was calculated at indicated time after fMLF stimulation. Data shown are mean ± SD collected from (n=3) separate preparations of neutrophils. *, P<0.01 versus WT neutrophils. ** p<0.0001 versus WT neutrophils. (J) Adhesion of WT and Grx1−/− neutrophils on fibronectin-coated flow chambers in response to fMLF stimulation. Scale bar represents 50 µm. (K) Grx1 disruption reduced fMLF induced cell adhesion on fibronectin-coated flow chambers. * p<0.001 versus WT neutrophils. (L) In vitro phagocytosis assay. FITC-labeled Zymosan A bioparticles were opsonized with mouse serum and incubated with neutrophils at 37°C for indicated time. Extracellular fluorescence was quenched by trypan blue. The results shown are representative of three experiments. (M) Phagocytosis index (PI) was expressed as the number of bioparticles engulfed by 100 neutrophils. (N) Binding index was expressed as the number of bioparticles bound to 100 neutrophils (4°C for 30 min). (O–P) In vitro phagocytosis assay using pHrodo labeled E.coli bioparticles. Results are the means (±SD) of three independent experiments. *p < 0.01 versus WT neutrophils (Student’s t test). Scale bars in L represent 10 µm. Scale bars in O represent 5 µm.

