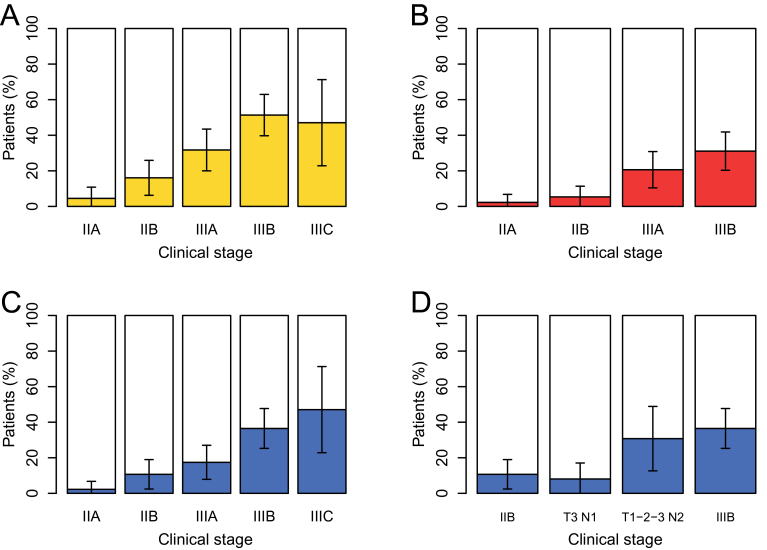
Figure 3.
Yield of fluorodeoxyglucose positron emission tomography/computed tomography (18FDG-PET-CT) according to initial clinical American Joint Committee on Cancer subgroup and tumor nodes metastases subset. A) Percentage of stage modification. B) Percentage of N3 disease uncovered by PET-CT. All patients with clinical N3 (stage IIIC) were also confirmed on PET-CT and are not represented here. C) Percentage of patients with distant metastases uncovered by PET-CT. D) Percentage of patients with distant metastases uncovered by PET-CT for specific tumor node metastases subsets of stage IIIA. The yield in T3 N1 patients is similar to that of stage IIB, whereas the yield in patients with clinical N2 disease is similar to that in stage IIIB patients (D). Error bars on each graph show the 95% confidence interval.

