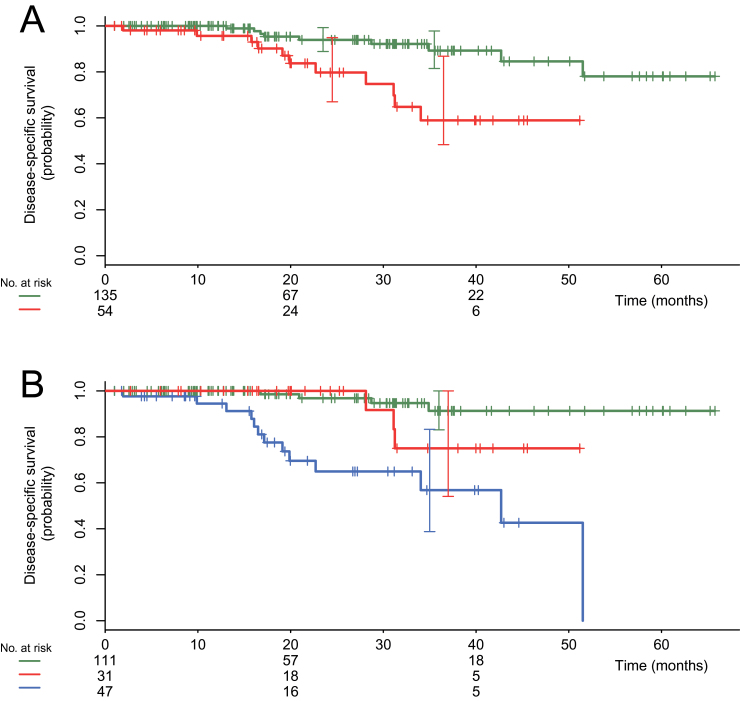
Figure 5.
Kaplan–Meier disease-specific survivals for the 189 patients with clinical stages IIB, IIIA, IIIB, and IIIC disease. Comparison of patients with and without N3 disease (infraclavicular, supraclavicular, or internal mammary lymph nodes) shown by fluorodeoxyglucose positron emission tomography/computed tomography. A) Comparison of patients with and without N3 disease. The upper curve (in green color online) shows patients without N3 disease (n =135; events = 9). The lower curve (in red color online) shows patients with N3 disease (n = 54; events = 11). Log-rank P equals .001. B) Women with M1 disease separated from others. The upper curve (in green color online) shows patients without N3 disease and without distant metastases (n = 111; events = 4). The intermediate curve (in red color online) shows patients with N3 disease and without distant metastases (n = 31; events = 3). The lower curve (in blue color online) shows patients with distant metastases (n = 47; events = 13). Log-rank P equals .16 between the two upper curves.

