
Figure 5.
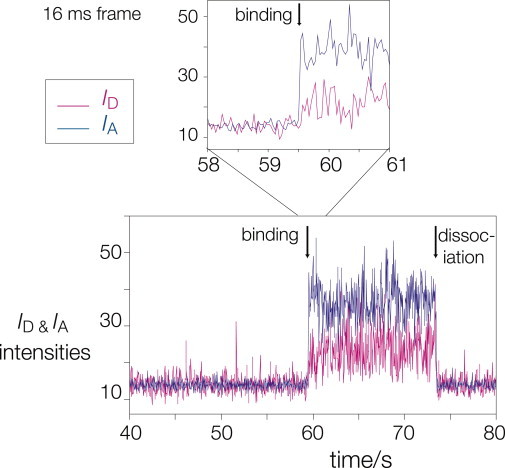
Observation of a Kt-7 molecule binding to L7Ae. A time-trace of ID and IA showing the increase in both signals on binding of the RNA to the fusion protein (at 59.5 s) at 16-ms frame rate. The expansion of the binding region shows that both intensities rise within a single frame. At 74 s, both ID and IA fall back to their initial levels. This could be due to dissociation of the complex or photobleaching of Cy3. Further examples are shown in the Supporting Material.