
Figure 6.
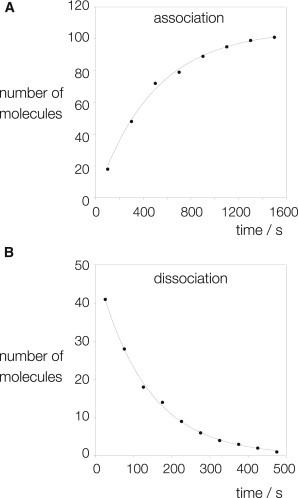
Estimation of binding and dissociation rates from single-molecule data. The times of association were measured as the interval after injection, before a given bound molecule with active Cy3 and Cy5 fluorophores was observed. If a clear dissociation event (such as the example in Fig. 5) was seen, this time was recorded and the lifetime of the bound Kt-7 calculated. (A) Plot of the cumulative number of bound molecules as a function of the time interval, postinjection. The data have been fitted to a single exponential rise. (B) Plot of the cumulative number of bound molecules remaining observable on the surface as a function of the time interval after the initial binding event. The data have been fitted to a single exponential decay.