
Figure 4.
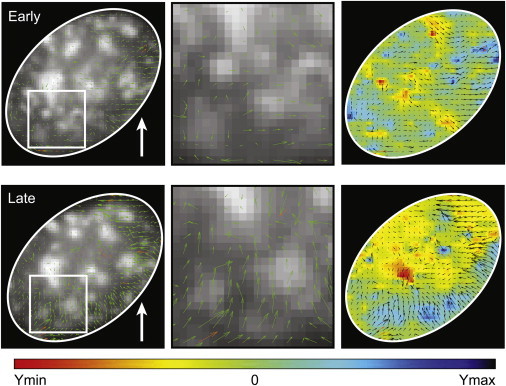
Analysis of subnuclear movements shows temporal and spatial changes in movement. Fib-GFP signals in HUVEC sheared at 40 dyn/cm2 for 1 h were processed by PIV. Magnitude and direction of movement (green arrows) were overlaid for early shear stress (15 min postshear) and late shear stress (33 min) for the whole nucleus and for a zoom into a peripheral section. Color maps of binned regions within the nucleus shows movements in the direction of flow (blue, Ymax) versus against the direction of flow (red, Ymin). In the early regime there are movements in and against the direction of flow (equal red and blue). At long times, the nuclear movements, particularly at the edge, show an increased movement in the direction of flow (Ymax). Three cells were analyzed and representative images from a single cell are shown here.