
Figure 8.
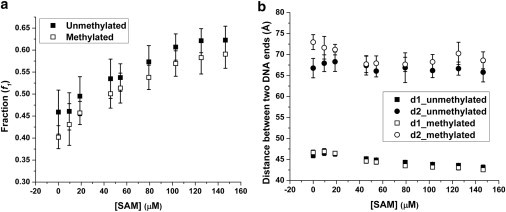
The effect of different SAM concentrations on (a) the fraction of the compact nucleosome state (the fractions of the unmethylated and methylated samples are statistically different from each other with p-value < 0.02 using a t-test); and (b) the conformations of the two nucleosomal states. Data points: mean ± 1σ, nunmet = 28, nmet = 21. The sample contains 10 mM KCl and 0 mM MgCl2.