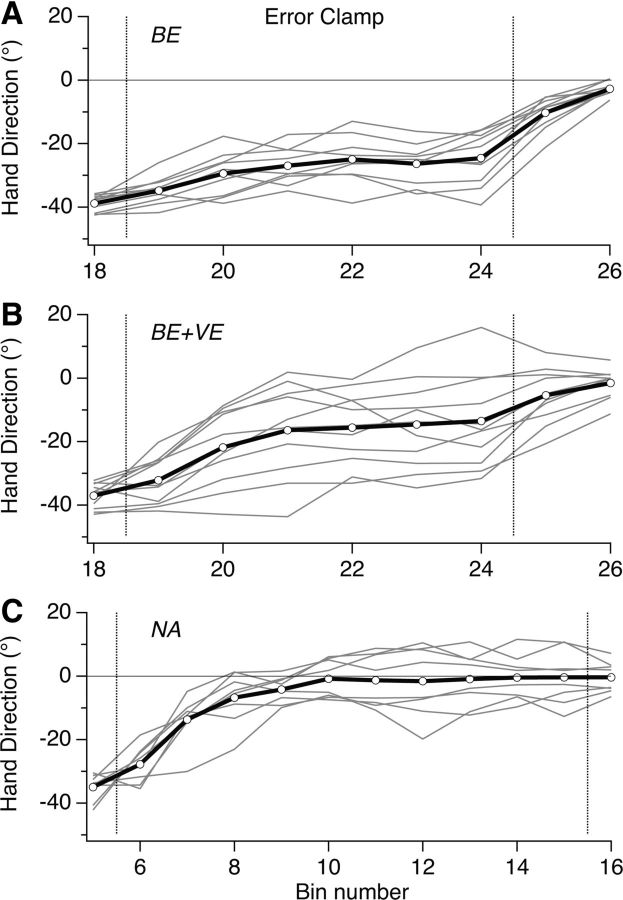
Figure 3.
A–C, Decay behavior for individual subjects (gray lines) during the error-clamp block plotted along with the group mean (thick black line) for Groups NA (A), BE+VE (B), and BE (C). Trials averaged across 10-trial bins. Vertical lines bound the clamp block. Intersubject variability is higher for Group BE+VE.

