. 2012 Dec 18;1:e00117. doi: 10.7554/eLife.00117

Figure 4. CLB3 misexpression disrupts protection of centromeric cohesin.

Cyclin expression was induced after 2 hr 15 min (C) and (D), 2 hr 30 min (A), (B), (E), (F) and (H) or 3 hr (G) and (I) of sporulation. (A) Chromosomal association of Rec8-13myc was monitored by ChIP-chip in wild-type (A28716) and CUP-CLB3 (A28718) during prophase I arrest. Centromere position is identified by a black circle. (B) Centromeric Rec8 localization was monitored in spread nuclei from wild-type (A28684), CUP-CLB3 (A28685) and CUP-CLB4 (A28686) cells carrying REC8-3HA (red) and NDC10-13myc (green) (n > 40). The fraction of spread nuclei that were Rec8 positive or negative was compared to wild-type using a chi-square test (df 1): CUP-CLB4, χ2 = 0.001323, p=0.9710; CUP-CLB3, χ2 = 32.79, p<0.0001. (C) Rec8 cleavage monitored by Western blot after release from an NDT80 block (4 hr 30 min) in wild-type and CUP-CLB3 carrying both a myc-tagged REC8 allele as well as either HA-tagged REC8 or rec8-29A allele (left to right: A29957, A29959, A29961, A29963). (D) Percentage of cells with short bipolar spindles was determined at indicated times in wild-type (A22804), CUP-CLB3 (A29965), rec8-29A (A22803) and CUP-CLB3 rec8-29A (A29967) after release from an NDT80 block (4 hr 30 min) (n = 100 per time point). (E) ChIP analysis for total Rec8, p-S179 Rec8 or p-S521 Rec8 from metaphase I-arrested (cdc20-mn) wild-type (A28681), CUP-CLB3 (A28682) and Sgo1-depleted (sgo1-mn; A29994) cells. Relative occupancy at a chromosome arm site (c194) or at a centromeric site (CENV) was determined relative to a low binding region (c281). Error bars represent range (n = 2). (F) Chromosomal association of Sgo1-3V5 was monitored by ChIP-chip in wild-type (A29795) and CUP-CLB3 (A29799) cells during prophase I-arrest. Centromere position is identified by a black circle. (G), (H) Localization of Sgo1-9myc (G, green) or Rts1-13myc (H, green) relative to Ndc10-6HA (red) determined by nuclear spreads in (G) wild-type (A22868) and CUP-CLB3 (A22870) or (H) wild-type (A28329) and CUP-CLB3 (A28330) during prophase I (n > 40). For (G), the fraction of spread nuclei that display colocalized or mislocalized Sgo1 relative to Ndc10 was compared between wild-type and CUP-CLB3 using a chi-square test (df 1) χ2 = 1.554, p=0.2125. For (H), the fraction of spread nuclei that display colocalized, partial or mislocalized Rts1 relative to Ndc10 was compared between wild-type and CUP-CLB3 using a chi-square test (df 2) χ2 = 3.712, p=0.1563. (I) Localization of Sgo1-9myc (green) in binucleates relative to Ndc10-6HA (red) determined by nuclear spreads from wild-type (A22868) and CUP-CLB3 (A22870) (n > 40). The fraction of spread nuclei that were Sgo1 positive or negative was compared between wild-type and CUP-CLB3 using a chi-square test (df 1) χ2 = 23.92, p<0.0001.

DOI: http://dx.doi.org/10.7554/eLife.00117.017

Figure 4.

Figure 4—figure supplement 1. Chromosomal association of Rec8 in CUP-CLB3 cells.

Figure 4—figure supplement 1.

Wild-type (A26547) and CUP-CLB3 (A26548) cells were induced to sporulate and CuSO4 (50 μM) was added 3 hr after transfer into sporulation medium. Rec8-3HA localization (red) was determined in spread nuclei from prophase I cells. DNA is shown in blue.
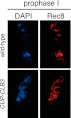
Figure 4—figure supplement 2. Chromosomal association of Pds5 in CUP-CLB3 cells.

Figure 4—figure supplement 2.

Wild-type (A28681) and CUP-CLB3 (A28682) cells carrying the cdc20-mn allele were induced to sporulate and CuSO4 (50 μM) was added 2 hr 30 min after transfer into sporulation medium. Pds5 localization was determined by ChIP-chip from metaphase I-arrested cells. Black balls depict centromere positions.
Figure 4—figure supplement 3. CUP-CLB3 cells partially bypass the nuclear division delay of mam1∆ cells.

Figure 4—figure supplement 3.

Wild-type (A22678), CUP-CLB3 (A22702), mam1∆ (A31340) and mam1∆ CUP-CLB3 (A31342) cells carrying the GAL4-ER and GAL-NDT80 fusions were induced to sporulate and CuSO4 (50 μM) was added 2 hr 15 min after transfer into sporulation medium. Cells were released from the NDT80 block 4 hr 30 min after transfer into sporulation medium. The percentage of cells that had undergone one or two meiotic divisions was determined at the indicated time points (n = 100 per time point).
Figure 4—figure supplement 4. Meiotic progression of the cells analyzed for Rec8 cleavage in Figure 4C.

Figure 4—figure supplement 4.

REC8-myc/REC8-HA (A29957), REC8-myc/rec8-29A-HA (A29961), REC8-myc/REC8-HA CUP-CLB3 (A29959) and REC8-myc/rec8-29A-HA CUP-CLB3 (A29963) cells carrying the GAL4-ER and GAL-NDT80 fusions were induced to sporulate and CuSO4 (50 μM) was added 2 hr 15 min after transfer into sporulation medium. Cells were released from the NDT80 block 4 hr 30 min after transfer into sporulation medium. The percentage of cells in metaphase I (grey symbols), anaphase I (violet symbols), metaphase II (dark blue symbols) and anaphase II (green symbols) was determined at the indicated times (n = 100 per time point).
Figure 4—figure supplement 5. Analysis of Rec8 cleavage in cells used for Figure 4D.

Figure 4—figure supplement 5.

Wild-type (A22804), CUP-CLB3 (A29965), rec8-29A (A22803) and rec8-29A CUP-CLB3 (A29967) cells carrying the GAL4-ER and GAL-NDT80 fusions were induced to sporulate and CuSO4 (50 μM) was added 2 hr 15 min after transfer into sporulation medium. Cells were released from the NDT80 block 4 hr 30 min after transfer into sporulation medium. Levels of full-length Rec8, cleaved Rec8, Clb3 and Pgk1 were monitored by Western blot.
Figure 4—figure supplement 6. Meiotic progression of the cells analyzed for Rec8 cleavage in Figure 4D.

Figure 4—figure supplement 6.

Wild-type (A22804), CUP-CLB3 (A29965), rec8-29A (A22803) and rec8-29A CUP-CLB3 (A29967) cells carrying the GAL4-ER and GAL-NDT80 fusions were induced to sporulate and CuSO4 (50 μM) was added 2 hr 15 min after transfer into sporulation medium. Cells were released from the NDT80 block 4 hr 30 min after transfer into sporulation medium. The percentage of cells in metaphase I (grey symbols), anaphase I (violet symbols), metaphase II (dark blue symbols) and anaphase II (green symbols) was determined at the indicated times (n = 100 per time point).
Figure 4—figure supplement 7. Chromosomal association of Sgo1 in CUP-CLB3 cells.

Figure 4—figure supplement 7.

Wild-type (A28712) and CUP-CLB3 (A28713) cells carrying the cdc20-mn allele were induced to sporulate and CuSO4 (50 μM) was added 2 hr 30 min after transfer into sporulation medium. Sgo1-3V5 localization was determined by ChIP-chip, 7 hr after transfer into sporulation medium when cells were arrested in metaphase I. Arm peaks for Sgo1 correspond to cohesin-associated regions. The basis for Sgo1 enrichment at these sites is currently unclear. Black balls depict centromere positions.
Figure 4—figure supplement 8. Localization of Rts1 in CUP-CLB3 cells.

Figure 4—figure supplement 8.

Wild-type (A28331) and CUP-CLB3 (A28332) cells carrying the cdc20-mn allele were induced to sporulate and CuSO4 (50 μM) was added 2 hr 30 min after transfer into sporulation medium. Rts1-13myc (green) localization relative to Ndc10-6HA (red) was determined in spread nuclei from metaphase I-arrested cells (n > 40).
Figure 4—figure supplement 9. Chromosomal association of Spo13 in CUP-CLB3 cells.

Figure 4—figure supplement 9.

(Left panel) wild-type (A30856), CUP-CLB3 (A30858) and CUP-CLB4 (A30860) cells carrying the GAL4-ER and GAL-NDT80 fusions were induced to sporulate and CuSO4 (50 μM) was added 2 hr 15 min after transfer into sporulation medium. Spo13-3V5 localization was determined by ChIP from prophase I-arrested cells. Relative occupancy at a centromeric site (CEN5) relative to a low binding region (HMR) was determined. Error bars represent the range (n = 2). (Right panel) wild-type (A30743), CUP-CLB3 (A30745) and CUP-CLB4 (A30747) cells carrying the cdc20-mn allele were induced to sporulate and CuSO4 (50 μM) was added 2 hr 30 min after transfer into sporulation medium. Spo13-3V5 localization was determined by ChIP 7 hr after transfer into sporulation medium when cells were arrested in metaphase I. Relative occupancy at a centromeric site (CENV) relative to a low binding region (HMR) was determined. Error bars represent the range (n = 2).
Figure 4—figure supplement 10. Rts1 localization in binucleate CUP-CLB3 cells.

Figure 4—figure supplement 10.

Wild-type (A28329) and CUP-CLB3 (A28330) cells were induced to sporulate and CuSO4 (50 μM) was added 2 hr 30 min after transfer into sporulation medium. Rts1-13myc (green) localization relative to Ndc10-6HA (red) was determined in spread nuclei from binucleates (n > 40). Using a chi-square test (df 2) the fraction of spread nuclei that display strong, weak or negative Rts1 with respect to Ndc10 was compared between wild-type and CUP-CLB3 χ2 = 54.49, p<0.0001.
Figure 4—figure supplement 11. Analysis of Rts1 localization in Rec8 phosphomimetic mutants.

Figure 4—figure supplement 11.

Wild-type (A29645) and rec8-S136D S179D S197D T209D (A29647) cells were induced to sporulate and Rec8-3HA/rec8-4D-3HA or Rts1-3V5 localization relative to Ndc10-13myc was determined in spread nuclei from binucleates (n > 40). Characterization of rec8-S136D S179D S197D T209D has been described in Katis et al. (2010). Note that strains carrying this allele fail to maintain centromeric cohesin beyond metaphase I (bottom panel). These binucleates also have weak Rts1 staining (top panel), suggesting that Rts1 maintenance at centromeric regions in anaphase I depends on cohesin. For top panel, using a chi-square test (df 2) the fraction of spread nuclei that display strong, weak or negative Rts1 with respect to Ndc10 was compared between wild-type and CUP-CLB3 χ2 = 18.02, p=0.0001. For bottom panel, using a chi-square test (df 2) the fraction of spread nuclei that display strong, weak or negative Rec8 with respect to Ndc10 was compared between wild-type and CUP-CLB3 χ2 = 121.2, p<0.0001.